


Is Oil Fueling the Rise in Political Partisanship?
Politics / Crude Oil Dec 11, 2011 - 04:29 PM GMTBy: Submissions

 Tom Therramus submits: In 2009 I published a chart in an article at Oil-Price.net that showed volatility in the price of oil had risen and fallen in a series of seven spikes during the prior decade. The turbulent year of 2008, when oil jumped to over $140 a barrel, was part of this series. But what was unexpected was just how early in the 2000s the signature of spiking volatility in oil price had gotten under way.
Further digging led to other surprises. It was found that each of the seven spikes in oil price volatility had been followed by knock-on impacts in the stock market, the price of gold and other economic indicators. Moreover, the relationship was not just confined to the 2000s. In another chart (Figure 1) it was shown that oil volatility spikes had closely preceded every US recession and market crash of the last 50 years.
Figure 1 - Historical Oil Price Volatility
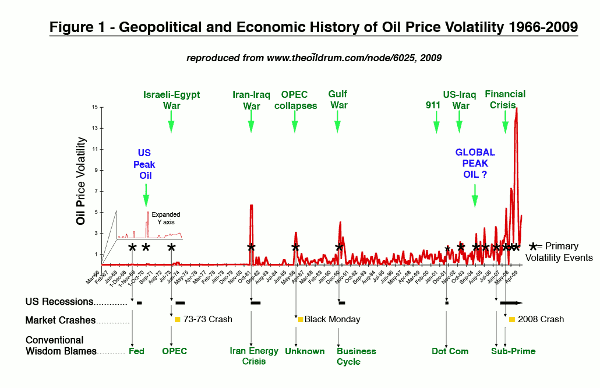
Indeed, even the mysterious 1987 "Black Monday" crash, the largest one-day decline in stock market history, appeared to fall in line with the pattern. Charting historical data, it stood out like a "sore thumb" that "Black Monday" had occurred in the wake of a price shock sparked by a collapse of the OPEC cartel in 1986.
The striking coupling between whipsaw changes in oil price and economic turbulence left me wondering about whether this relationship had broader implications. In particular, I was curious as to whether the volatility signature for oil price that had emerged over the 2000s might also be influencing the moods and preferences of American voters.
The US is arguably the most fossil fuel-dependent nation on earth. It is also widely acknowledged that the degree of electoral volatility and political partisanship has increased in the United States in recent years. Could discontent sparked by an uptick in volatility in oil prices be one reason behind why American politics of late seems to have gotten so much nastier ?
To go after this question three US political polls were looked at in relation to volatility in the price of oil between December 1999 and July 2010. These polls were: 1) Presidential approval ratings 2) Congressional approval ratings and 3) Direction-of-the-Country in which potential voters are asked whether they feel that the country is on the "right track" or the "wrong track".
The data for these polls are archived at RealClearPolitics.com and PollingReport.com. The rationale, methods and approach taken are laid out in detail in a wiki that was started in November 2010. Figure 2 summarizes the first of the findings illustrated from the wiki. Here, volatility in oil price between 2000 and 2010 is lined up against volatility in polling data on Presidential popularity.
Figure 2 - Presidential Approval Ratings
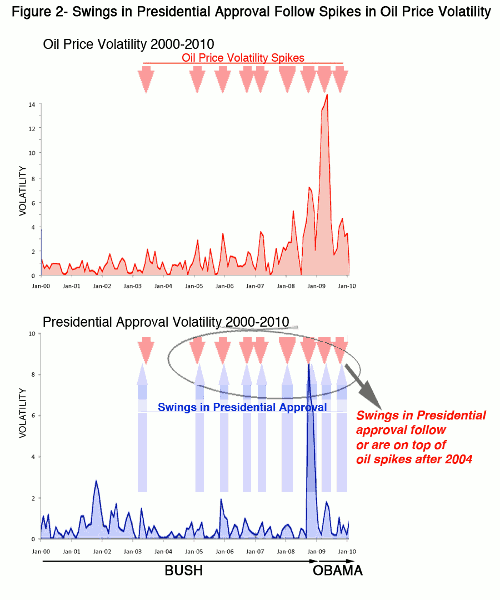
From Figure 2 it can be seen that between 2000 and 2004 there was not too much going on between oil and Presidential popularity. But, at the start of the second term of the Bush Presidency something changes. A relationship similar to that observed between oil and the economic indicators begins to emerge. From 2004 onwards, wobbles in Presidential popularity consistently tend to pop up a month or so down the road from each oil spike.
This pattern of oil bumps followed by Presidential wobbles seems to pay little heed to who is in the White house. It starts with President Bush and continues pretty much unchanged through the Obama Presidency. I should mention that the same relationship holds with the other two polls. If anything, swings in "Congressional approval" and "Direction of the country" polls seem even more impacted by volatility in oil price than Presidential polls.
Eyeballing the two charts on Figure 2 is one way that relationships between the cycles of volatility shown can be assessed. However, there is a type of helpful math called Fourier transform that is able to look for embedded rhythms in such data objectively and determine if these rhythms are related to each other or not.
Music provides an example of how Fourier transform works. Middle C on a tuned piano is a single note that results from sound waves vibrating our ear drums 523 times a second. If these sound waves are recorded onto a computer and a Fourier transformation applied to them, the resulting graph or frequency spectrum of the note is a sharp peak at the vibrating frequency of middle C i.e., 523 cycles per second.
When Fourier transform was used to search for rhythms hidden in oil volatility and swings in polling data over the 64-month time frame between December 1999 and March 2005, no simple relationship between oil market instability and US political polls could be picked out. The frequency spectrums during the first five or so years of the 2000s were as complicated as Rachmaninoff piano chords.
During the 64-months from April 2005 to July 2010 the story got simpler and a lot more interesting. As can be seen on Figure 3, the frequency spectrums for Oil, Presidential approval and "Direction-of-the-Country" collapsed to a single main peak during this approximately 5-year time window. Specifically, Fourier transform showed that volatility in oil price, Presidential approval and Direction-of-the-Country were tuned to the same "note" or repeating cycle, in which spikes popped-up every 32.3 months.
Figure 3 - Swings in Presidential Approval and Direction-of-the-Country Polls are In-Tune with the Oil Volatility Cycle
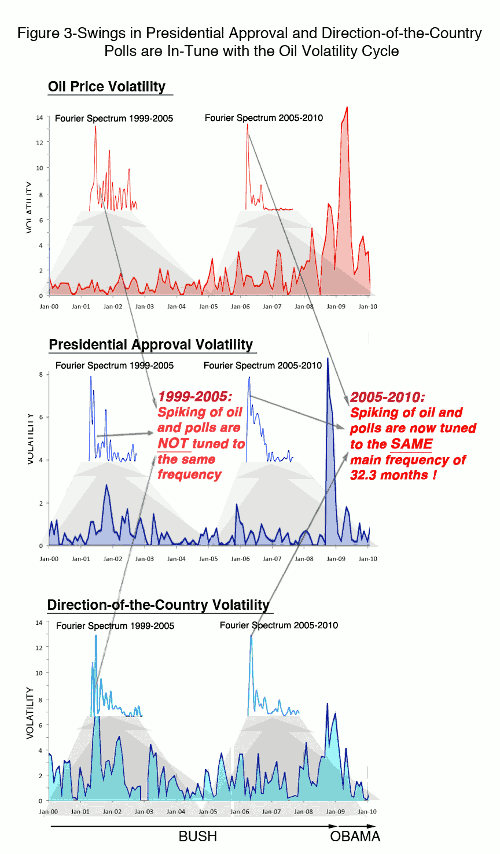
In summary, Fourier tells us that between 1999 and 2010 oil and politics went from showing no relationship to having an extremely strong one.
It should be emphasized that this analysis is backwards looking. Its conclusions are based on a 128-month stretch that began from December 1999. It is also cautioned that the pattern may not be stable going forward. The 32.3 month period identified from the retrospective Fourier analysis is not predictive, as oil markets are... well... volatile.
This being said, the first oil price spike of the new decade topped out in April 2011, exactly 32 months after oil reached its all time high in July 2008. Also notable is that shortly thereafter in September 2011 President Obama's approval rating fell to the lowest level of his Presidency.
Correlation is not causation and all that - but these data do give one pause. It also leads to the question of what is causing the spikes in oil price volatility? The conventional wisdom is that this is yet another dismal manifestation of the Wall Street casino. The assumption is that greedy commodity traders are the villains at the root of market volatility. But there is another explanation - albeit a more troubling one.
According to the US Department of Energy, the global rate of oil production has not risen appreciably since 2005. Production has remained flat for about the last five to six years. There is no danger that we are going to run out of oil soon. In fact, we have never been more awash in the black stuff. This being said, all evidence suggests that we may be at or approaching a geoplanetary limit to oil supply, even though demand continues to grow.
The plateau in global oil production may continue for years before a decline sets in. However, the teetering balance between flat supply and rising demand is what some experts believe to be the more likely source of the whipsaw changeability in oil price that is shown over the time period from 2000 to 2010 in Figures 1 and 2.
In sum, the jagged pattern of volatility in oil price that is now underway could be a process that is as automatic as a heart beat. This rhythmic pattern may be a natural by-product of our insatiable thirst for oil in a finite world, and something over which we may ultimately have limited control.
The prospect that no amount of extra drilling is going damp down spiking oil prices is a message that I do not expect to hear from any politician running for office in the coming Presidential election. All the same, here is a thought that should get the rapt attention of every pol - A "rinse and repeat" cycle in oil price volatility could have become a key determinant of whether you will win your election or not!
For the rest of us, the impact of cycling volatility in oil price on our economy, partisan politics and social fabric is likely to grow in seriousness. Expressions of discontent including the Tea Party, Occupy Wall Street, or even the inability of GOP conservatives to settle on a Presidential champion may be manifestations of this "rinse and repeat" cycle. Adapting to the increasing uncertainty and political unrest wrought by recurring jolts in oil price volatility may be one of larger challenges that we face in coming years.
Acknowledgments: Mike the Mechanic is thanked for his help with the Fourier transformation analysis.
Therramus is a neutered Tom. He can be contacted at TomTherramus at gmail dot com
This article was originally posted on Oil-Price.net, the leading oil price information site. http://www.oil-price.net/en/articles/is-oil-fueling-rise-in-political-partisanship.php
© 2011 Copyright Oil-price.net- All Rights Reserved Disclaimer: The above is a matter of opinion provided for general information purposes only and is not intended as investment advice. Information and analysis above are derived from sources and utilising methods believed to be reliable, but we cannot accept responsibility for any losses you may incur as a result of this analysis. Individuals should consult with their personal financial advisors.
© 2005-2022 http://www.MarketOracle.co.uk - The Market Oracle is a FREE Daily Financial Markets Analysis & Forecasting online publication.