


Stock Market a Little More Consolidation?
Stock-Markets / Stock Markets 2011 Dec 12, 2011 - 02:17 AM GMTBy: Andre_Gratian

 SPX: Very Long-term trend - The very-long-term cycles are down and, if they make their lows when expected, there will be another steep and prolonged decline into 2014.
SPX: Intermediate trend - The current action suggests that a wave "C" from 1075 is underway.
Analysis of the short-term trend is done on a daily basis with the help of hourly charts. It is an important adjunct to the analysis of daily and weekly charts which discusses the course of longer market trends.
Market Overview
Last week's headline was : "WAVE C DUE FOR A PAUSE". The SPX obliged by surrendering 36 points into Friday morning, after which it rallied for the rest of the day and closed near its high. So! Are we ready to push ahead with Wave C?
Perhaps not right away. Although Friday's action was bullish, and the index closed near its high of the day, it's possible that the consolidation is not quite over. At best, this would be wave 1 of the new uptrend, with a wave 2 pull-back before the SPX is ready to surpass its 1267 high. At worst -- and cycles seem to argue for this scenario -- the consolidation could extend for another week or so before the index is ready to challenge its short-term high.
Over the intermediate term, it remains likely that we are in a wave "C" rally from 1075, and that we have completed its first phase at 1267. But if my instincts are right, Friday's rally may only be the mid-point of the consolidation. If so, that would mean an extension of range-bound trading, followed by the genuine resumption of the wave "C" uptrend. 1231 is a strong support level and is not likely to be broken.
It sounds as if I speak of wave "C" as if it is already etched in stone. Actually, I have learned to keep an open mind about structure and to "go with the flow". If we have a nasty decline after completing this "wave C", then we can be fairly certain that the bear market has resumed. If not, I'll have to re-adjust my thinking.
The near-term trend will be decided by what happens on Monday. A P&F projection is looking for a move to 1260-1261, followed by a pull-back with 1231 likely to hold.
Chart analysis
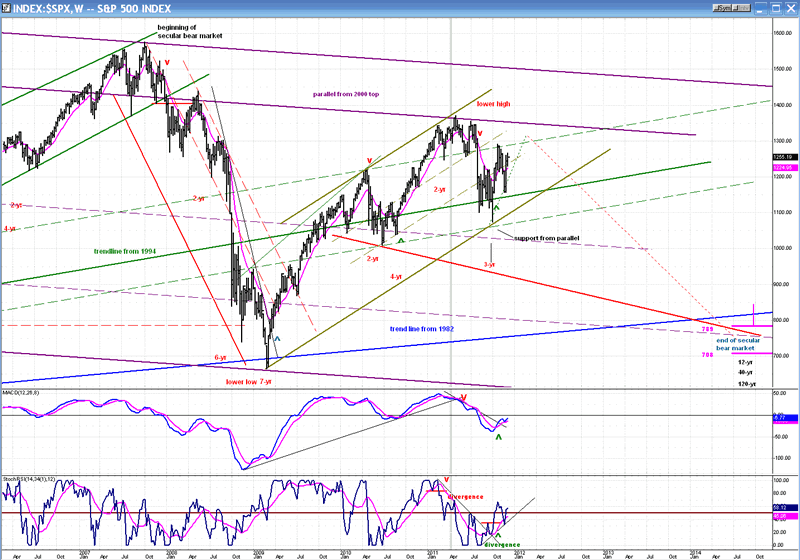
We'll begin with our long-term model which shows the progress of the secular bear market since the October 2007 top. It is expected to take the form of a large corrective move which is two-thirds complete and has probably already made its high at 1370 and begun a long descent into 2014.
The model is based primarily on the Kress cycle theory which is looking for a major low when the 120-wk cycle bottoms in (October?) 2014. The SPX is following the projected script and, if it continues, we can soon expect an intermediate top and the start of increasing weakness ahead. The "if" is, of course, the determining factor.
The prevailing view is that we are now in wave "C" from 1075, which would bring us to a top fairly soon and be followed by prolonged weakness. One problem with this scenario is that it seems to be much too soon to be launching ourselves into a sharp decline that will last until 2014. One way to mark time would be to expand the "C" wave into a large flat. That would delay the top of minor wave 2 until much later in 2012. There are other potential scenarios as well.
Over the short term, whether this move turns out to be wave "C" or "A" of minor 2, neither structure is complete and more upside is expected before it is.
The Daily Chart will give us a better idea of where we are in the current structure -- whatever it turns out to be. After making its low at "B" (1159), the SPX started another strong rally which stopped just below the lower level of the top resistance band which had formed between 1258 and 1370. It has now corrected for about a week and (Friday) tried to resume its uptrend. Until it gets above 1267, it will be vulnerable to some additional consolidation.
Once it does get past 1267, the next level of resistance will be the former short-term top of 1292. If wave "C" is a zigzag, as expected, and the "C" wave matches the "A" wave in length, the SPX could reach about 1375, which would take it to a new high. I am not expecting such strength, but I do have P&F projections which call for a potential 1314, and a possible 1340. Most likely, the "C" wave will not exceed the red downtrend line from 1370.
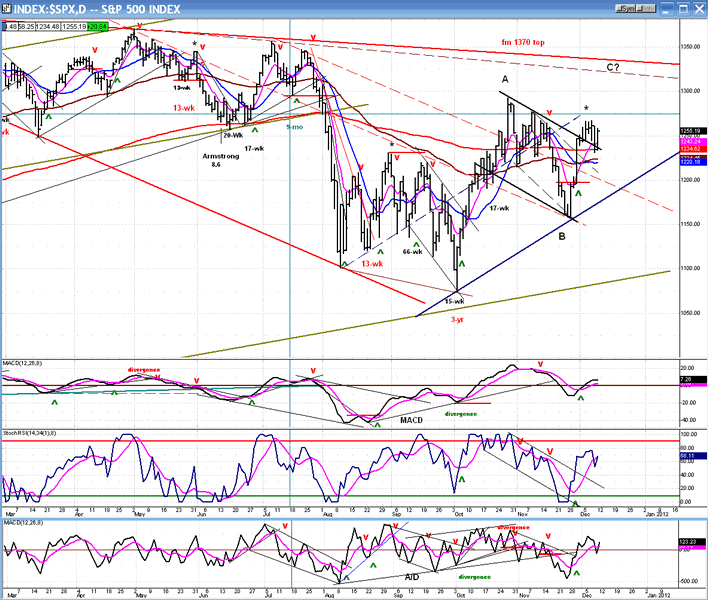
The price and the indicators both suggest that a consolidation is underway, not a reversal.
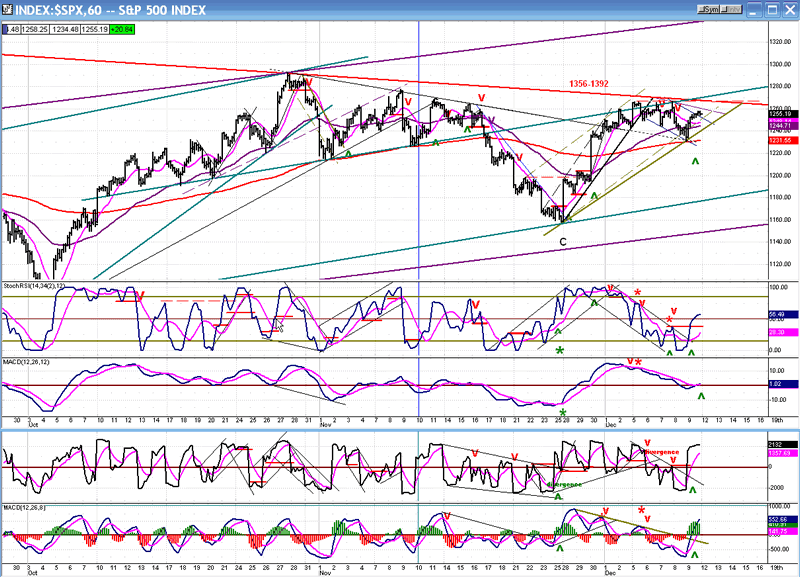
Next, we'll analyze the Hourly Chart. After making its low at the 1260 projection, the SPX started a new uptrend which went 106 points in 5 days with hardly any consolidation. By then, momentum indicators were overbought and started to show some negative divergence. Over the next three days, the index tried to push to higher grounds but finally gave up after a third try. During this time, the momentum indicators were correcting and, by the time the index sold off into the last hour on Thursday, they were already oversold and ready to start a rally on the news that the Eurozone had made some progress in resolving its difficulties.
At the close of Friday, there was deceleration, but no sell signal, and the indicators as well as the P&F chart suggested that the SPX could move a couple of points higher to 1260-61. That would be a logical spot for the rally to end and to continue the consolidation started on 12/05. Should there be a need for a little more upside, the next projection is to 1266, the former high. It would take some exceptional strength on Monday for the index to move beyond that level, especially since this is where it would encounter the downtrend line from 1356 in addition to the resistance from the former near-term tops.
A muted opening on Monday would probably signal the end of the bounce from 1231. We will then have to decide if we only pull back for a couple of days and resume the uptrend, or if we continue to consolidate for a week or so (preferred).
Cycles
The 14-15-wk high-to-high cycle proved its consistency, once again, and caused the SPX to pull back a quick 36 points which were mostly regained on Friday.
There is another cycle low due around 12/18-19, which could create some additional consolidation before we attempt to move beyond the former near-term high of 1267.
Breadth
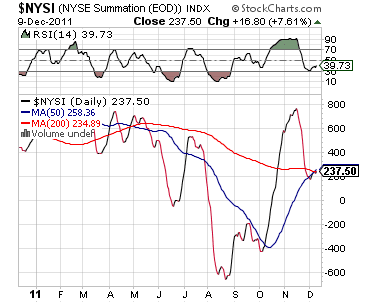
The Summation Index (courtesy StockCharts.com) has held at the junction of its 50 and 200 DMAs. Since its RSI has turned up, but is still oversold, another move up is probable. This would confirm the continuation of the wave "C" pattern in the SPX.
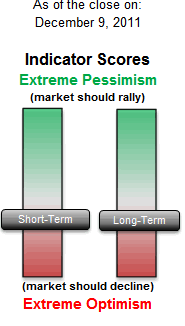
Sentiment
There has been a noticeable decline in the SentimenTrader (courtesy of same) in the past week. If this continues, it will be alerting us to an important top in the market. Of course, this is what we expect.
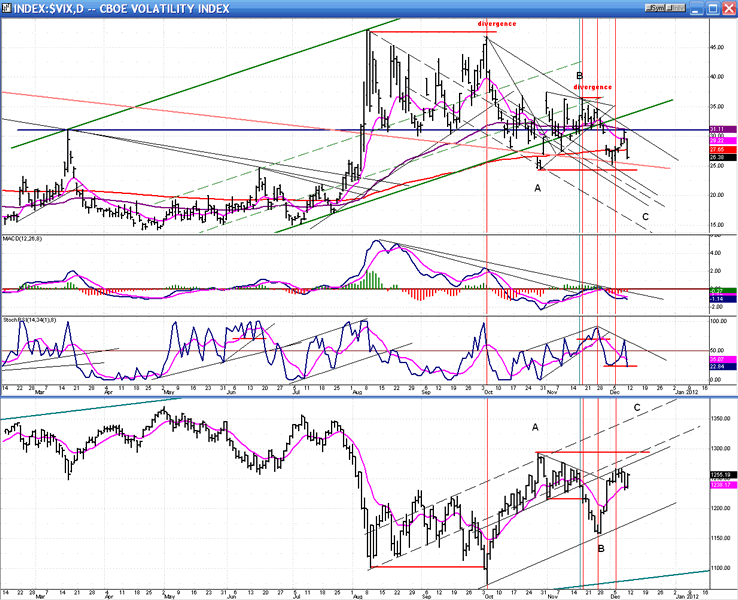
The VIX
Contrary indicators are going to be a standard feature of this newsletter. Combined, and viewed in concert with the SPX, these indices are most helpful in anticipating important market reversals.
Starting with the VIX, if one has any doubt that the market has farther to go on the upside, look at the action of the VIX last week. When it first sold off in early December, the index went down almost to the former support level of late October. Last week, it rallied for four days then sold off sharply again (almost down to the same level) as the SPX rallied. This is not the behavior characteristic of a contrary indicator which is ready to signal a market top.
For now, the VIX is pretty much in inverse sync with the market, making an inverted ABC pattern. I expect it to make a new low as both indices reach their C destination. The VIX found support on its 200-DMA and the extension of its top long-term channel line, but it is most likely destined to break below both decisively as it reaches "C".
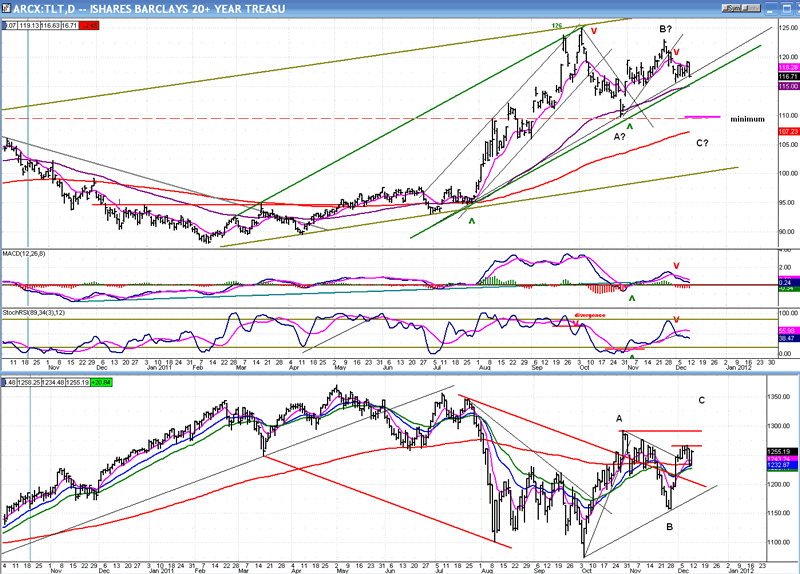
BONDS (TLT)
The bond market, represented here by TLT is stronger than the stock market over the long term, but its intermediate pattern suggests that it's also making an ABC consolidation pattern. To complete the pattern, it will have to come out of its green channel and probably target the 110 level, which would be the level of it last short-term low.
TLT is stronger than the VIX. It is trading well above its 200-DMA and is still near the top of its long-term channel. This long-term strength strongly suggests that the SPX is in a long-term downtrend which should become evident after both indices have completed their ABC pattern.
UUP (Dollar ETF)
Finally, we need to look at what the dollar is doing. It is also a contrary indicator, although there
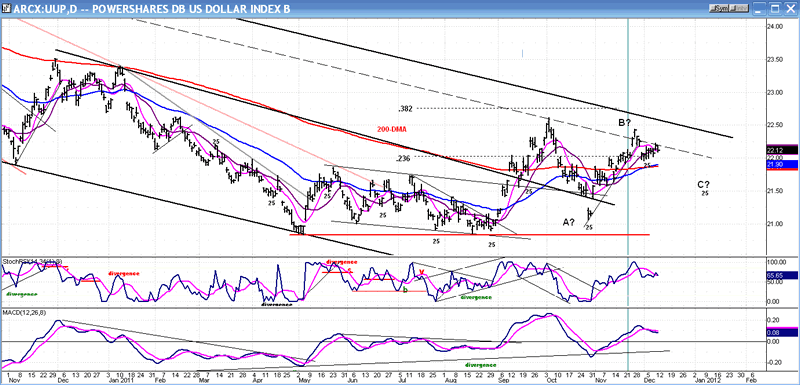
have been times when it moved in the same direction as the market. As an example: from November 2010 to June 2011, both indices were in an uptrend. This means that we have to take its contrariness with a grain of salt and mostly depend on the two preceding indices. I also follow a couple of confirming indicators which often give me some advance notice about reversals in all time frames.
For the time being, the dollar index appears to be in a contrary mode, and is expected to complete an ABC correction also. Considering the longer-term pattern of the dollar, the correction that it has undergone since its early October high looks very much like a wave 2, after which it will be in a position to break out of its long-term downtrend channel.
Summary
"A pause is expected to take place this week", was how last week's summary started. And a pause did occur although, by Friday, the SPX "appeared" ready to resume its uptrend.
This may be deceptive and there could be another week of mild consolidation ahead of us. Whether it's a week or three days-long is moot, because it's only a question of time before the index continues on its upward path.
FREE TRIAL SUBSCRIPTON
If precision in market timing for all time frames is something which is important to you, you should consider a trial subscription to my service. It is free, and you will have four weeks to evaluate its worth.
For a FREE 4-week trial. Send an email to: ajg@cybertrails.com
For further subscription options, payment plans, and for important general information, I encourage you to visit my website at www.marketurningpoints.com. It contains summaries of my background, my investment and trading strategies and my unique method of intra-day communication with Market Turning Points subscribers.
By Andre Gratian
MarketTurningPoints.com
A market advisory service should be evaluated on the basis of its forecasting accuracy and cost. At $25.00 per month, this service is probably the best all-around value. Two areas of analysis that are unmatched anywhere else -- cycles (from 2.5-wk to 18-years and longer) and accurate, coordinated Point & Figure and Fibonacci projections -- are combined with other methodologies to bring you weekly reports and frequent daily updates.
“By the Law of Periodical Repetition, everything which has happened once must happen again, and again, and again -- and not capriciously, but at regular periods, and each thing in its own period, not another’s, and each obeying its own law … The same Nature which delights in periodical repetition in the sky is the Nature which orders the affairs of the earth. Let us not underrate the value of that hint.” -- Mark Twain
You may also want to visit the Market Turning Points website to familiarize yourself with my philosophy and strategy.www.marketurningpoints.com
Disclaimer - The above comments about the financial markets are based purely on what I consider to be sound technical analysis principles uncompromised by fundamental considerations. They represent my own opinion and are not meant to be construed as trading or investment advice, but are offered as an analytical point of view which might be of interest to those who follow stock market cycles and technical analysis.
Andre Gratian Archive |
© 2005-2022 http://www.MarketOracle.co.uk - The Market Oracle is a FREE Daily Financial Markets Analysis & Forecasting online publication.