


Where Is Silver Price Going?
Commodities / Gold and Silver 2011 Dec 15, 2011 - 02:51 PM GMTBy: Hubert_Moolman

 Silver and gold are in the process of bottoming, and should rally very soon. The depth of the recent decline may be surprising; however, it does not signal the end of the bull market. The fundamentals for silver and gold are very strong, and it has not changed over the last couple of days
We are still using fiat money, as well as debt levels are still extremely high. The massive debts brought about by the debt-based monetary system, is not just going to go away. A few things have to happen before debt is brought to acceptable levels.
The debts have to be paid or defaulted on. Either way, that means significantly reduced economic activity (Depression) world-wide. That likely also means another big stock market crash. Before this happens it would be foolish to talk about a top in precious metals, since these conditions (a deflating debt bubble) are what will drive gold and silver prices significantly higher.
In a few of my previous articles, I have shown how one can use gold as a leading indicator, to predict what may happen to the silver price. I stated the following:
"So, there is not just a similarity in how gold and silver trade at the same time period, but also how they trade at similar milestones, despite the fact that those milestones are sometimes reached at different times. This can cause silver or gold to be the leading indicator, depending on the particular milestone".
I would like to continue with that theme, and use gold's past patterns to suggest how the silver price will perform over the next couple of months.
Below is a graphic that compares the silver chart (from 2007 to today), to the gold chart (from 2008 to 2010) (all charts generated at fxstreet.com):
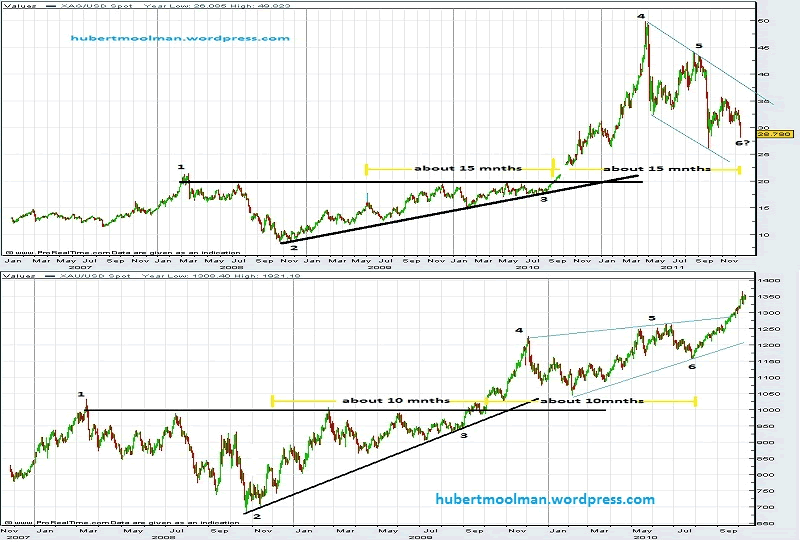
The top chart is for silver and the bottom is for gold. I have highlighted how similar patterns exist on both charts. On both charts are ascending triangles, marked 1 to 3, out of which the price broke out to the upside. After the break-out, price increased significantly, from where both formed a consolidation pattern.
The ascending triangle for silver (roughly 30 months) is much bigger than that of gold (roughly 19 months). The consolidation patterns for both charts took roughly the same amount of time to form, relative to their ascending tri-angles (about half of the time of the tri-angles).
So, from these two charts, it seems that silver is still following gold's lead - but, are those consolidating patterns similar? It might not be clear that they are similar, but let's take a closer look.
Below, I compare the two consolidating patterns, to see if there are any similarities:
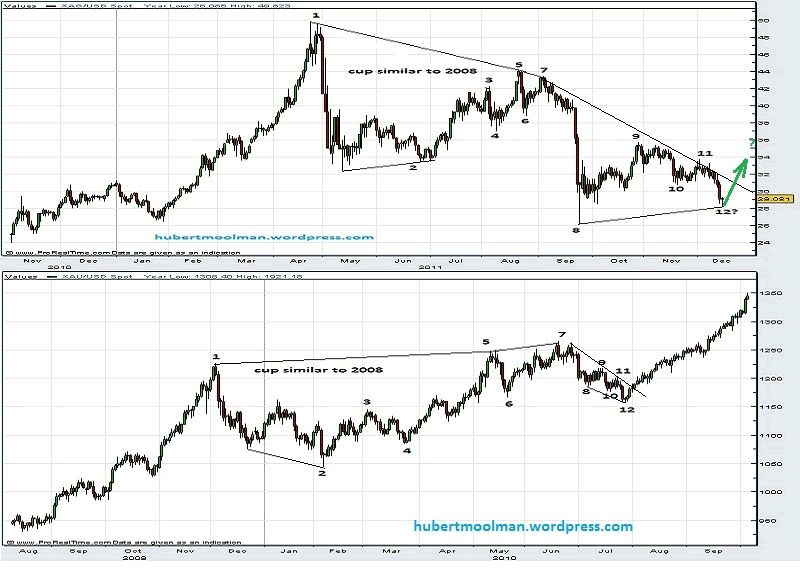
Again, the top chart is for silver and the bottom for gold. I have highlighted significant points (1 to 12) on both charts to suggest how the patterns may be similar. The first significant similarity to point out, is the fact that the first part of both patterns formed a cup (points 1 to 5), which are similar to cups formed, right at the beginning of both their respective triangles. (See the previous chart - the cups start at point 1 and finishes halfway to point 2).
The fact that the first part of both patterns are similar to cups within their respective triangles, lends more justification for comparing these patterns. One of the reasons why it might not be so apparent that these two patterns are similar, is the fact that the angle at which the patterns appear, are different overall, as well as for some individual patterns, within the pattern. For example, for gold the cup (1 to 5) slants upward, from left to right, whereas for silver it slants downwards.
Now, if you look at both chart in detail, and compare the points I have highlighted, you will see that they are quite similar. If these two patterns are indeed similar, then silver is searching for that point 12, which could already be in today, or could be in (lower) over the next couple of days.
If the similarity between the two patterns continues, then we could have a massive rally soon. This is therefore consistent with my previous analysis which calls for a much higher silver price over the next couple of months.
For more detailed silver analysis and silver price forecast, I have prepared a Silver Fractal Analysis Report. For more details, see my website.
Warm regards and God bless,
Hubert
Please visit my blog and website for more of my work and premium service. http://hubertmoolman.wordpress.com/
You can email any comments to hubert@hgmandassociates.co.za
© 2011 Copyright Hubert Moolman - All Rights Reserved
Disclaimer: The above is a matter of opinion provided for general information purposes only and is not intended as investment advice. Information and analysis above are derived from sources and utilising methods believed to be reliable, but we cannot accept responsibility for any losses you may incur as a result of this analysis. Individuals should consult with their personal financial advisors.
© 2005-2022 http://www.MarketOracle.co.uk - The Market Oracle is a FREE Daily Financial Markets Analysis & Forecasting online publication.