


Stocks Bull Bear Market Inflection Point
Stock-Markets / Stock Markets 2011 Dec 18, 2011 - 05:43 AM GMTBy: Tony_Caldaro

 A somewhat disappointing week as investor sentiment, in many areas, flipped from positive to negative. Losses from 2%+ to 4%+ were observed thoughout all of the world’s regions. Commodities confirmed downtrends losing 4.6% on the week. Crude oil and Gold lost 6%+. Ten year Bond rates confirmed another downtrend, (rising Bond prices). And, the USD resumed its uptrend gaining 2.1%. Risk off was definitely in vogue. For the week the SPX/DOW were -2.7%, and the NDX/NAZ were -3.5%. On the economic front indicators continued to improve as positive reports outnumbered negatives at a 2:1 ratio for the third week in a row. On the downtick: retail sales and industrial production turned lower, while export/import prices remained negative. On the uptick: business inventories, the NY and Philly FED, the CPI/PPI, the budget deficit, weekly jobless claims, excess reserves, and the WLEI all displayed improvement. Next week we’ll receive the final estimate for Q3 GDP, projected around +2.0%, and several reports on Housing. Best to your week!
LONG TERM: inflection point
Many have compared the current market action to that of the first half of the 2007-2009 bear market. And rightfully so, even from an OEW perspective. During the first half of that bear market the equity market started a five wave decline from Oct07-Mar08 with each wave taking one month to unfold. The market lost 20% of its value in five months. This completed a wave A. The market then rallied for two months, retracing 57% of that entire decline, to complete a wave B. What followed, in the second half of that bear market, was another five wave decline with each of the waves taking longer than a month to unfold. And, the final loss was the largest decline since 1929-1932, a loss of 58% in market value.
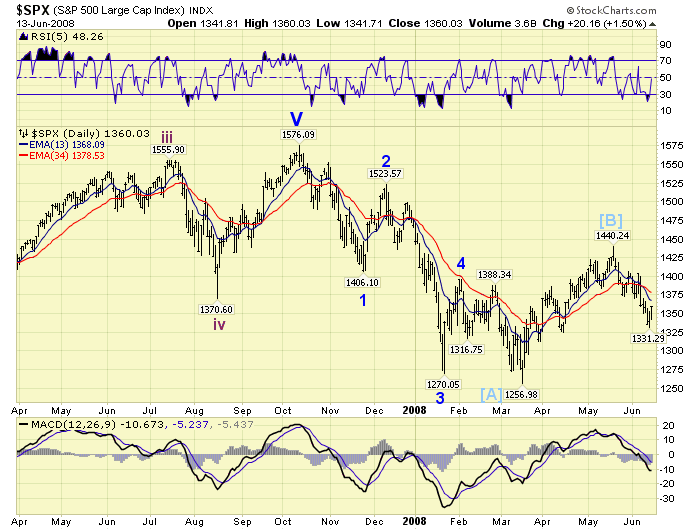
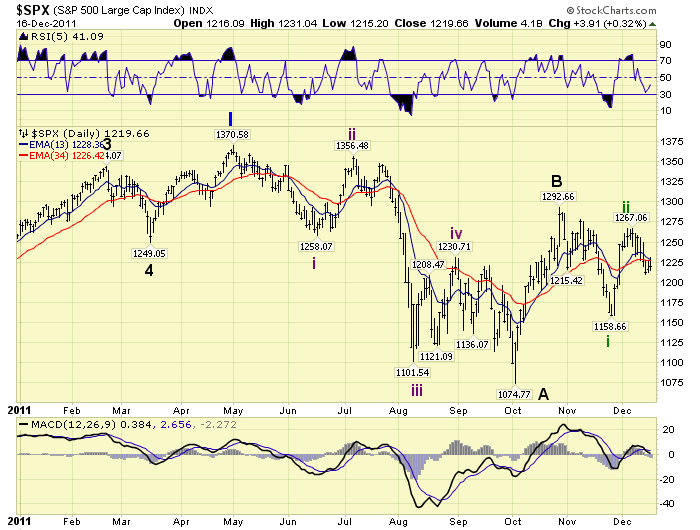
Our current market placed a top in May11. Then it declined in five waves, each taking one month to unfold, into an Oct11 low. The wave count is different but the structure is similar. The total market loss was also a similar 22%. This could also have completed a wave A. The market then rallied for just one month, retracing a larger 74% on that entire decline. After that this market looks like it has declined in one wave to SPX 1159 in Nov11, and rallied in another wave to SPX 1265 in Dec11. Both of these waves are also one month in duration, and can be counted as waves 1 and 2 of wave C. Thus far, the first half of both bear markets looks similar. Yet, the second half of this potential bear market appears to be moving quicker: all waves one month in duration. This comparison appears to be approaching an inflection point.
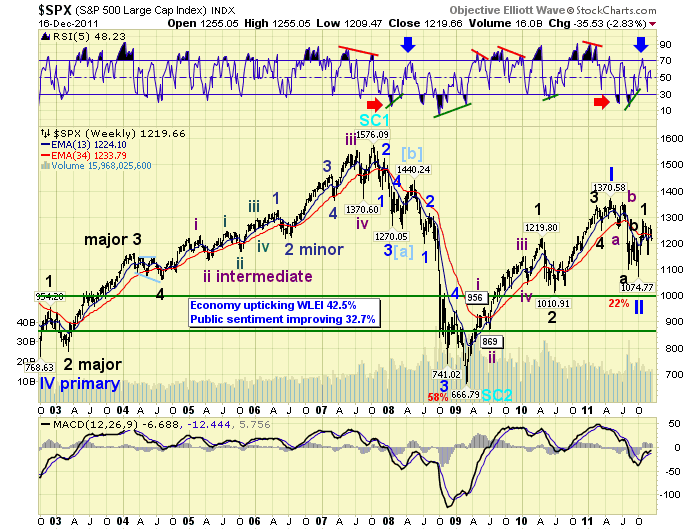
When we look back at 2011 we see a market that has traded in a broad nearly 300 point range: SPX 1075-1371. And, it closed within 3 points of the precise middle of that range on friday. The first half of the year the market marked time in the upper end of the range forming a top. The second half of the year, especially beginning in early August, the market traded in the bottom half potentially forming a bottom.
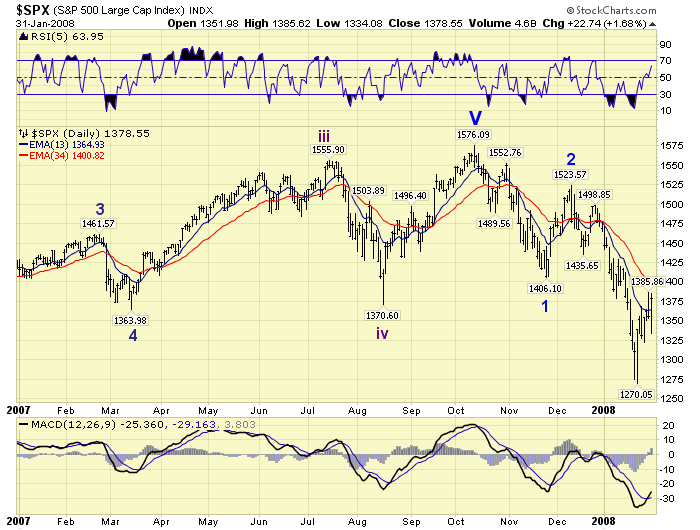
In 2007 the market spent the entire year in a tighter trading range: SPX 1364-1576. And, ended the year within 2 points of the exact middle of that range. Then, it had spent the first ten months of the year forming a top and started to weaken heading into year end. The first few weeks of 2008 was the defining moment for the bull/bear market debate. The market started to break down on the first day of trading in the new year. A long term OEW downtrend was confirmed. And, the bear market was underway in earnest.
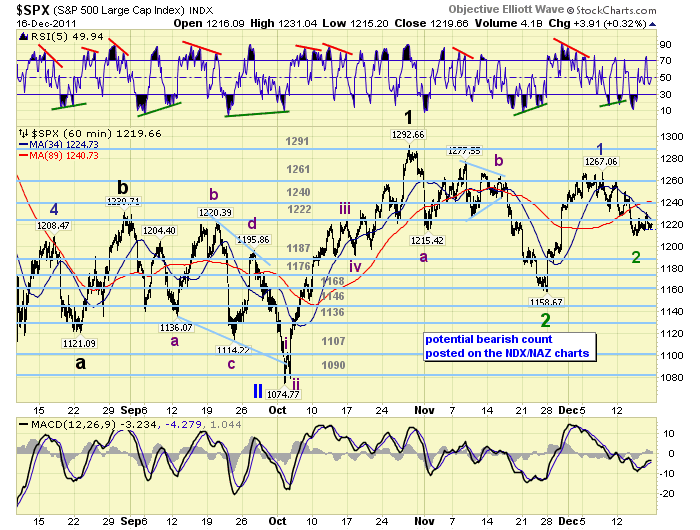
As we head into 2012 it would appear the prudent action would be to hedge one’s portfolio, at current levels, until most traders/investors return in the first few weeks of the new year. If the market survives the month of January without confirming a new downtrend and making lower lows, (below SPX 1159), then the hedge could be removed. If it rallies above SPX 1293 then the hedge can be removed as well. Both situations would indicate the correction/bear market ended in early Oct11. A drop below SPX 1159, and then 1075, would indicate the bear market is continuing. These bearish counts are carried on the NDX/NAZ charts.
MEDIUM TERM: DOW confirmed uptrend, other majors have not
In addition to a series of difficult one month trends since May11, we are now confronted with a fragmented market. When the DOW confirmed an uptrend a week ago we expected the SPX, NAZ and NDX to follow in short order. This is normally how these trends unfold. Instead, we have observed nearly every rally sold off since that uptrend confirmation, and all in the same day. This week, for example, the market opened higher on three days, rallied some 14-15 points from the previous close, and then ended the day near the lows. This is not good market action. However, there are some positives at work.
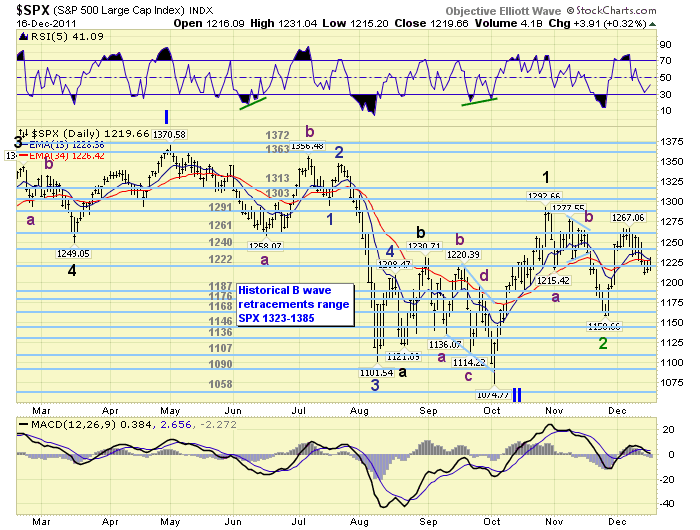
First, the recent decline from SPX 1267 is quite choppy, and does not look bearishly impulsive at all. Second, the Oct11-Nov11 downtrend from SPX 1293-1159 was also corrective. This type of activity normally occurs in bull markets. Third, the uptrend from the SPX 1075 low to 1293 looked impulsive and similar to a kickoff/resumption of a bull market. Fourth, the Aug11 – Oct11 downtrend, from SPX 1231-1075 ended in a diagonal triangle, which usually occurs at the termination of a larger decline. Fifth, our long term indicators, i.e. bond risk, market breadth, the NYAD, and the VIX to name a few, do not look as negative as they did in 2008. As a result of these observations we continue to carry a more bullish count. This count is posted on the SPX charts.
SHORT TERM
Support for the SPX is at 1187 and then 1176, with resistance at 1222 and then 1240. Short term momentum is declining from an overbought condition of friday. Last weekend we reported the market looked fine. We had a rally, which the DOW confirmed as an uptrend, from the SPX 1159 Nov11 low. This confirmation also confirmed the previous decline from SPX 1293-1159 had ended and it was corrective. Bond prices were downtrending, (rates declining), the USD looked like it had a double top, most of the commodity sectors were in uptrends, and Gold appeared to be still in an uptrend. Risk appeared to be on.
The rally from SPX 1159 – 1267 looked impulsive. Then it had a 36 point pullback to SPX 1231 that thursday. Which was in the range of all the pullbacks during the SPX 1975-1293 uptrend. And the market closed the week at SPX 1255. On monday of this week the market gapped down, extending the pullback to 40 points, but still looked okay. Tuesday’s gap up opening was encouraging, as the market rallied to SPX 1250 by 10:00. But by the end of the day the market had sold off to an even lower low. For the rest of the week, as noted earlier, every rally was sold.
As the week unfolded all five commodity sectors confirmed downtrends. Bonds yields confirmed a downtrend, which suggests rising bond prices. Crude oil and Gold were sold off, with Gold confirming a downtrend and Crude quite close. And, the USD extended its uptrend, while the Euro downtrended further. The risk on trade had quickly shifted to risk off. And, finally none of the other three major indices, i.e. SPX, NDX, or NAZ confirmed the DOW’s uptrend. While we are maintaining our optimistic bullish count. We also have to be on the alert for a potential resumption of the downside risk associated with the European sovereign debt crisis.
EU politicians, after over a dozen meetings in the past year plus, still have nothing to show for their efforts but a lot of plans. The ECB, on the other hand, has taken definitive action in attempting to recapitalize european banks, and lowered the base interest rate after each of the last two monthly meetings. What Europe needs is an independent, autonomous ECB.
Short term support is at SPX 1209, 1197/98 and then the 1187, 1176, 1168 pivot cluster. Short term resistance is at SPX 1227/31, the 1240 pivot range, and then 1250. Best to your trading!
FOREIGN MARKETS
The Asian markets were all lower on the week losing 2.3%. Only Hong Kong remains in an uptrend.
The European markets were all lower as well losing 4.5%. Five of the seven indices we track remain in uptrends.
The Commodity equity group were all lower too. Brazil and Canada still remain in uptrends.
The DJ World index is still downtrending and lost 3.5% on the week.
COMMODITIES
Bond prices have nearly confirmed a new uptrend, while 10YR rates are now in a confirmed downtrend. Bonds gained 1.0% on the week.
Crude’s uptrend appears to have topped as Crude lost 6.0% on the week.
Gold confirmed a downtrend losing 6.6% on the week. The extent of the decline came unexpectedly. We’ll discuss the ramifications of this development in a separate report.
The USD resumed its uptrend gaining 2.1% on the week. The EURUSD and JPYUSD remain in downtrends.
NEXT WEEK
Another busy schedule this holiday week. Best to your holidays! Monday kicks off the week with the NAHB housing report at 10:00. On tuesday we have Housing starts and Building permits. Wednesday Existing home sales will be reported. Then on thursday, weekly Jobless claims, Q3 GDP, Consumer sentiment, Leading indicators and the FHFA housing index. On friday, Durable goods orders, Personal income/spending, PCE prices and New home sales. Nothing on the FED calendar thus far. Best to your week and happy holidays!
CHARTS: http://stockcharts.com/...
http://caldaroew.spaces.live.com
After about 40 years of investing in the markets one learns that the markets are constantly changing, not only in price, but in what drives the markets. In the 1960s, the Nifty Fifty were the leaders of the stock market. In the 1970s, stock selection using Technical Analysis was important, as the market stayed with a trading range for the entire decade. In the 1980s, the market finally broke out of it doldrums, as the DOW broke through 1100 in 1982, and launched the greatest bull market on record.
Sharing is an important aspect of a life. Over 100 people have joined our group, from all walks of life, covering twenty three countries across the globe. It's been the most fun I have ever had in the market. Sharing uncommon knowledge, with investors. In hope of aiding them in finding their financial independence.
Copyright © 2011 Tony Caldaro - All Rights Reserved Disclaimer: The above is a matter of opinion provided for general information purposes only and is not intended as investment advice. Information and analysis above are derived from sources and utilising methods believed to be reliable, but we cannot accept responsibility for any losses you may incur as a result of this analysis. Individuals should consult with their personal financial advisors.
© 2005-2022 http://www.MarketOracle.co.uk - The Market Oracle is a FREE Daily Financial Markets Analysis & Forecasting online publication.