


Financial Markets Dull Start To The New Year
Stock-Markets / Financial Markets 2012 Jan 08, 2012 - 09:08 AM GMT

 Another year passed, although the start to the New Year has so far has been anything but an explosive start, US markets are pretty stuck in a range and chopped traders to pieces, not exactly great conditions for making successful trades. Times like that I strongly suggest sitting it out and waiting for this market to makes its move.
Opening up 20 handles on the globex open and straight into resistance, did not fill me with joy to be buying and in fact that was pretty much the high all week expect for a spike off the NFP the ES stay in a choppy range and put traders to sleep with the consistent chop.
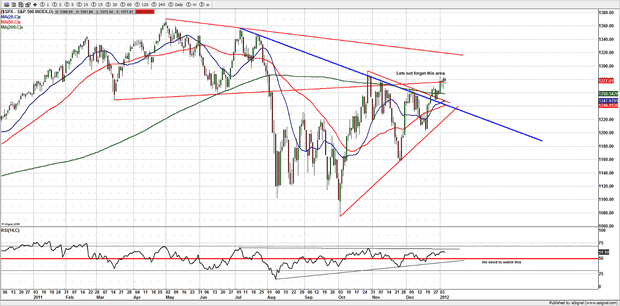
As of yet we don't have any evidence to support either direction although the last few daily candles suggest the trend is coming to an end, as seeing 3 candles like that back to back imo is a bearish setup, and showing that the trend is tiring, which is what I have been expecting only this market has still fell short of some ideal targets, but not done enough to suggest a high finally in from the Oct 4th 2011 lows, as the idea has not changed and still working a corrective bounce that potentially stalls out between 1300-1320SPX.
However the markets reluctance to actually push much higher than the 1280SPX area and is looking tired, so we may be looking at a failure. If readers may recall 1280SPX has been a very important area for us, and clearly its showing how important this area is as it vibrates and decides if it wants to continue from here.
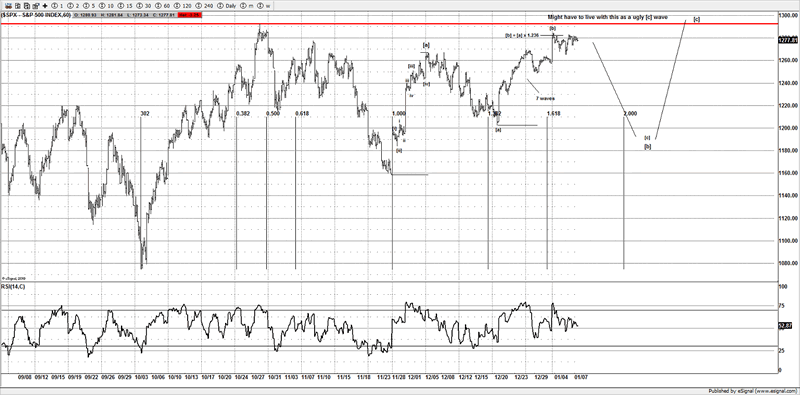
However there is the potential for what we Elliotticians call a "b wave trap". Simply put it's a failure to follow through on the upside here as the tape has got back above the prior swing high at 1266SPX. And the idea was to be looking for a move to take out the prior swing high further up at 1292SPX, thus seeing our target zone hit between 1292-1316SPX, the issue we have atm is that the structure has been anything but clean, so for us this is a nasty area to take a stance, whilst I can't rule out our target getting hit, what I don't want to be doing is getting caught in a trap here, as there is a very real chance this can push back under 1200SPX. A move back under 1268SPX would further suggest that scenario. So looking for some weakness early from Sundays open into Mondays ES session to help confirm that idea.
Although whilst it's not as clean as I would have liked to see on the ES/SPX, there are patterns that are far far cleaner imo that those that are seen on the US markets.
European Markets
The FTSE and DAX show a much clearer picture and it's what we have been using, sometimes looking at other similar markets that move in sync with your chosen markets helps a lot.
As you can see the DAX is potentially still in a impulsive wave structure and as long as it holds the 6000 area, I am going to give the benefit of doubt to the bulls for putting in a small 5th wave.
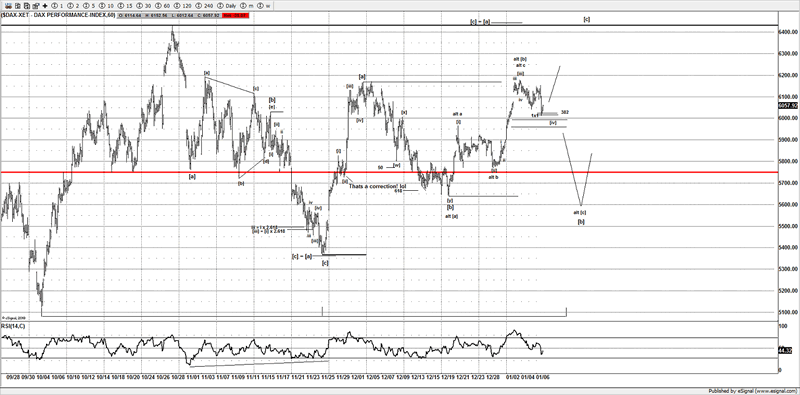
Failure to hold that 6000 area or weakness in the Sundays Asian session and push back under 1272ES will likely invalidate the impulsive count and push the DAX to open up under 6000 on Monday's cash session open, thus being a bearish sign short term as it will put pressure on the bulls.
Staying under 1272ES will also favor the bears going into next week, in fact 1272ES was a key area this week for us and remains so, and our bias is a buy above and sell below, but we are watching the FTSE and DAX for some ideas we are using early on Monday in the Asian and European ES session.
Yes we are 24hr traders, we trade all sessions, and frankly the past few months the action has really come in the European session.
Some are asking why we are watching Sundays open and into Mondays European session, well under 1272ES and saying under is a short term bearish trigger and whilst we tried on a few occasions to get under and stay under, we simply chopped and vibrated that area all last week, so it's important to use for direction over the coming week.
If the European markets break their trigger points and support, they open the door for lower prices and the potential "b wave trap" which is also evident on the European markets, should we see a loss of support.
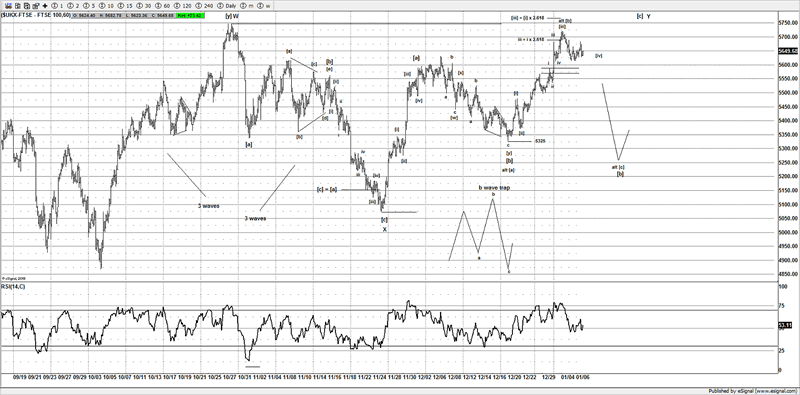
The FTSE shows the same ideas, although has been the stronger of the 2 between the FTSE and DAX.
So you can see the Elliott Wave Count appears to be cleaner than the US markets, and whilst we would like to have a clean Elliott Wave Count to use on the US markets, at times looking at similar ideas in other market helps clear some ideas up.
If the market hold 1272ES and the FTSE and DAX continue higher, I suspect the ES eventually will find its way to above 1290ES, thus forcing us to live with a distorted pattern on the SPX/ES and seeing our 1292-1316SPX target band hit, it's not been ideal but sometimes you just have to live with what you are dealt.
Since we are trying to follow the cleanest ideas to guide us, it's important to note the direction of the FTSE and DAX early next week for clues on the US markets.
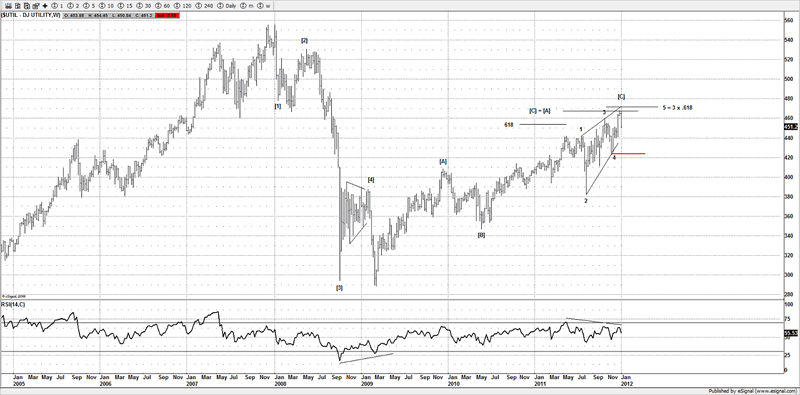
DOW UTIL
One market that is showing signs of break down after hitting our revised target is the Dow Utilities
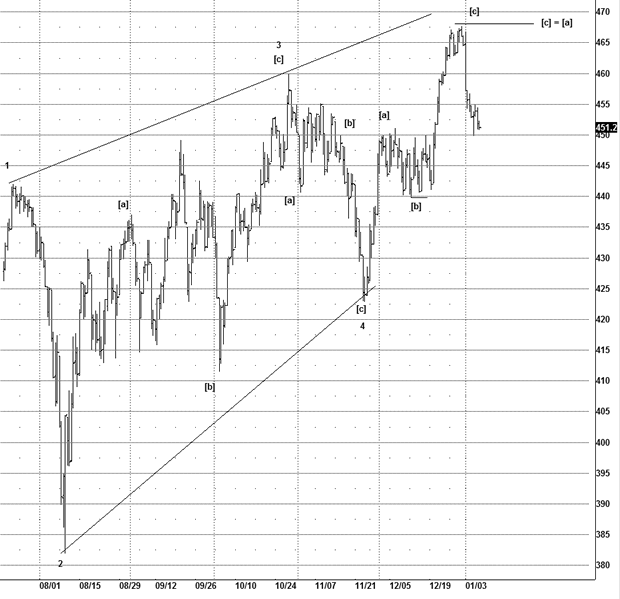
The reversal has been strong and suggests that we could have a major high in place, with a clean Ending Diagonal the impulsive decline shown on the short term charts is something that we are seriously considering this market is complete and an early sign that the rest of the US markets will follow lower.
My overall targets and bias has still not changed having put a high in last year; I still strongly believe that we will be testing the lows made back in Oct 4th 2011.
It would need a strong move above 1320SPX for me to reconsider that bias.
When I look at around at some of the FX risk pairs such as the AUD/USD and USD/CAD other US market sectors and individual mega cap stocks, it further supports the notion that I still do think that any secondary high will still find 1300-1320SPX a problem. Eventually the markets will head lower.
XLF
One sector that I am watching is the financials to see if they are potentially topping in a smaller Ending Diagonal (ED) here. This pattern shows some cleaner structure than the SPX or DOW, so a case of trying to find small but vital clues for trade ideas for next week.
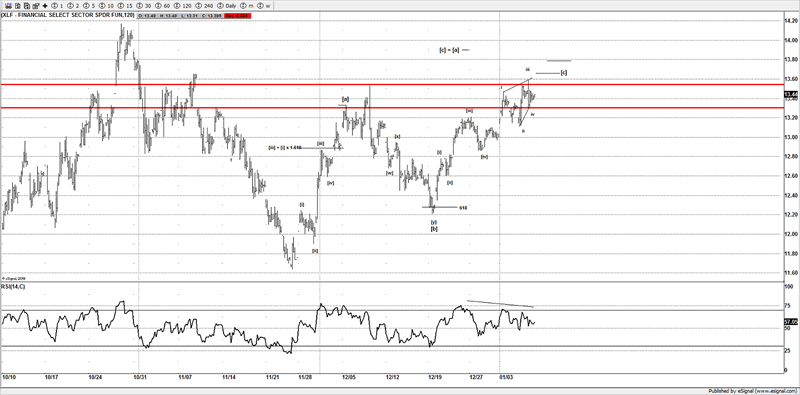
So I ideally want this to stall out around $13.66 then see a reversal.
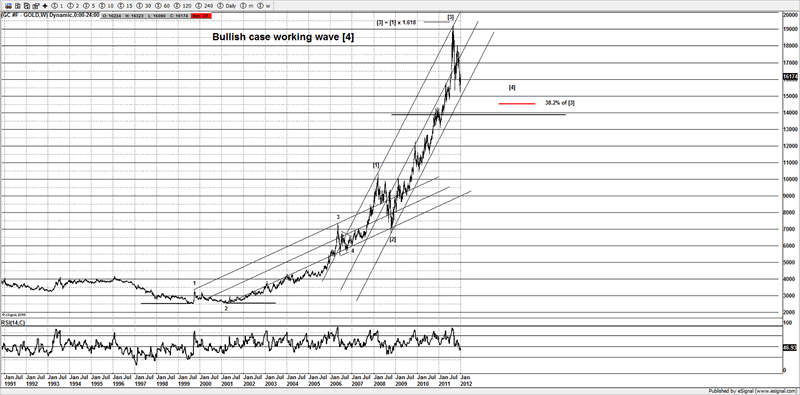
Gold
I won't put too much in writing as to do so would not be fair to members, however I have put a lot of effort this weekend in my usual weekend report to members, suffice to say we have some ideas and depending what happens on some key resistance and support areas, will help going forward.
If you want to follow analysis in a clear and concise manor then I do suggest taking a trial as gold is at a key inflection point and those that are switched on will be the traders that make the gains. Or simply sign up for the commodities only part of the site for $15 a month where you will have access to commodities section which includes regular updates of gold, silver and oil, and the grains (corn, wheat soybeans).
Already gold has bounced nearly $100 off the lows I mention in my last report, but it's not yet confirmed fully the direction it wishes to choose.
Bear or bull, the tape has not confirmed either direction, whilst I am still bullish at these levels, make no mistake I am fully away that any liquidity style event in the markets could see many markets puke as traders are forced to sell all assets.
Gold bull
Gold Bear
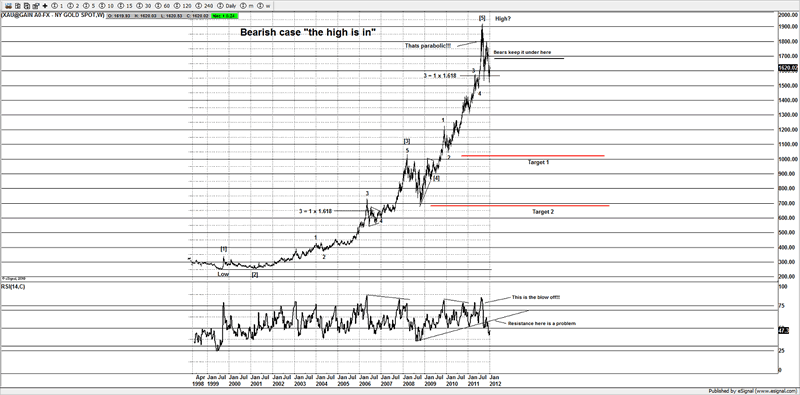
To find out more about my levels and what I am looking for, I suggest joining the site, it maybe the best $15 a month you ever spend. Remember I was one of only a few that was vocal about selling gold at $1850, and those that followed that call saved themselves a lot of pain, are you ready to follow the next gold call?
Conclusion
US markets pretty much in a coma last week and not exactly inviting us to take a stance, however we are going to continue to watch what happens around 1272ES early next week, although we do want to watch the FTSE and DAX for short term direction and 1272ES in globex.
We may have to be forced to live with a sloppy wave if the ES/SPX continues to push higher towards our target zone of 1292-1316SPX.
Until next time.
Have a profitable week ahead.
Click here to become a member
You can also follow us on twitter
What do we offer?
Short and long term analysis on US and European markets, various major FX pairs, commodities from Gold and silver to markets like natural gas.
Daily analysis on where I think the market is going with key support and resistance areas, we move and adjust as the market adjusts.
A chat room where members can discuss ideas with me or other members.
Members get to know who is moving the markets in the S&P pits*
*I have permission to post comments from the audio I hear from the S&P pits.
If you looking for quality analysis from someone that actually looks at multiple charts and works hard at providing members information to stay on the right side of the trends and making $$$, why not give the site a trial.
If any of the readers want to see this article in a PDF format.
Please send an e-mail to Enquires@wavepatterntraders.com
Please put in the header PDF, or make it known that you want to be added to the mailing list for any future articles.
Or if you have any questions about becoming a member, please use the email address above.
If you like what you see, or want to see more of my work, then please sign up for the 4 week trial.
This article is just a small portion of the markets I follow.
I cover many markets, from FX to US equities, right the way through to commodities.
If I have the data I am more than willing to offer requests to members.
Currently new members can sign up for a 4 week free trial to test drive the site, and see if my work can help in your trading and if it meets your requirements.
If you don't like what you see, then drop me an email within the 1st 4 weeks from when you join, and ask for a no questions refund.
You simply have nothing to lose.
By Jason Soni AKA Nouf
© 2012 Copyright Jason Soni AKA Nouf - All Rights Reserved
Disclaimer: The above is a matter of opinion provided for general information purposes only and is not intended as investment advice. Information and analysis above are derived from sources and utilising methods believed to be reliable, but we cannot accept responsibility for any losses you may incur as a result of this analysis. Individuals should consult with their personal financial advisors.
© 2005-2022 http://www.MarketOracle.co.uk - The Market Oracle is a FREE Daily Financial Markets Analysis & Forecasting online publication.