


The Gold Stocks are Tracking Past Equity Bull Markets
Commodities / Gold & Silver Stocks Jan 10, 2012 - 12:08 PM GMTBy: Jordan_Roy_Byrne

 All bull markets have similarities and all equity bull markets have strong similarities. They go through similar phases. Most bull markets start off slow and then build towards what we like to say is an acceleration into a bubble and potential mania. In last weeks editorial we noted how bull markets, prior to the bubble phase, tend to make major bottoms every three or so years. Yet, in looking at the present bull market in gold stocks and comparing it to the previous three equity bull markets (Technology, Japan and Gold Stocks) we find stronger and deeper similarities which confirms to us that the gold stocks are in the bull market of our time.
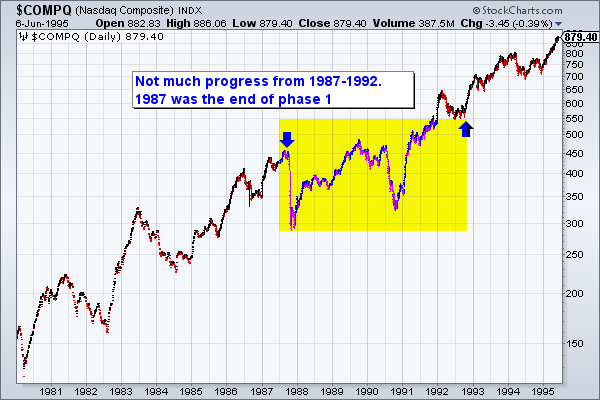
In examining these four bull markets we find that the typical secular bull market in equities follows a strong pattern. Most would assume that the bubble or mania phase is the strongest connection. While this is often the case its really the start of the bull market and middle phase that follow a textbook pattern. The first phase consists of a fairly strong rise over six or seven years while the second phase (through a correction or consolidation) consists of five or six years of no net progress. This sets the stage for the acceleration and eventual bubble phase.
The Nasdaq began its bull market in 1980 so its first phase ended with the historic stock market crash in 1987. The market rebounded fantastically through 1991 and 1992. However, it wasn’t until late 1992 that the market escaped a five year period of no net progress. Though not shown, it was 1995 when the market began to accelerate into its bubble.
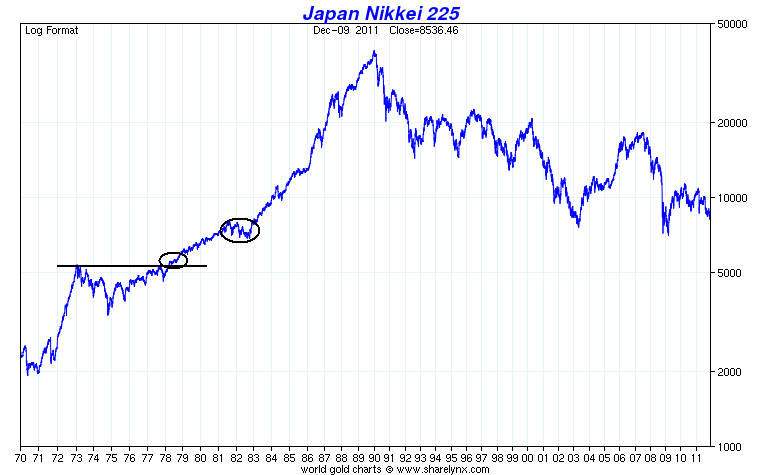
Next we have the Nikkei which shows Japan’s historic bull market. Looking at historical data shows the bull market began in earnest in 1967. The first phase ended in 1973. From 1973 to 1978, the market made little progress. After 1978 things really began to takeoff.
In our next chart we show a rebalanced look at the current bull market (HUI in red) and the bull market from the 1960s and 1970s (BGMI in blue). The time scale is aligned to the BGMI. Note the distinct similarities between each other but also to the aforementioned Nasdaq and Japan.
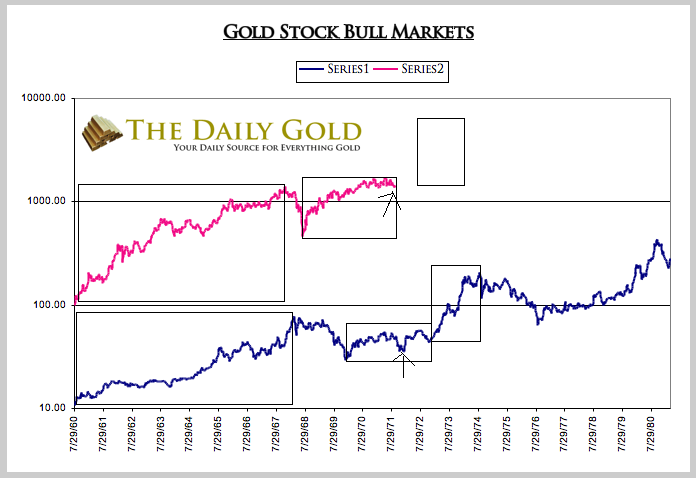
First, note that each market made its initial major peak at virtually the same time, about seven plus years in. Second, each market endured a major correction though each was different in time and scale. The HUI recovered more quickly but has yet to break away from the initial high. The HUI hasn’t made much progress since 2006 while the BGMI did nothing from 1968-1973. The BGMI made its final low (late 1972) almost five months after its initial peak. It was at that point when the BGMI would surge over the next 18 months to a new high. If the HUI follows the same path and scale then it would make its final bottom within weeks and gain strongly until the fourth quarter of 2013.
From this point forward the three historical bull markets essentially accelerated course and endured one final correction before the mania. The corrections were (BGMI 1975-1976, Nasdaq 1994, Japan 1981-1982).
The only distinction to make is that the gold stocks (BGMI) didn’t have the kind of mania the other two bull markets had. Perhaps that is just because mining is such a difficult business or that speculators concentrated on junior companies, silver and silver miners. In other words, the mania was centered outside of the senior gold companies.
In any event, its important to share these similarities as it shows that the struggles in the gold stocks are right on par with previous bull markets. Nothing that has happened is out of the ordinary. In fact it is only following the pattern of equity bull markets. Combined with the low valuations and low ownership of gold stocks, this is some very powerful evidence of what lies ahead. If you'd like professional guidance in riding this bull market and uncovering the winning companies then consider learning more about our premium service.
Good Luck!
Jordan Roy-Byrne, CMT
Trendsman@Trendsman.com
Subscription Service
Trendsman” is an affiliate member of the Market Technicians Association (MTA) and is enrolled in their CMT Program, which certifies professionals in the field of technical analysis. He will be taking the final exam in Spring 07. Trendsman focuses on technical analysis but analyzes fundamentals and investor psychology in tandem with the charts. He credits his success to an immense love of the markets and an insatiable thirst for knowledge and profits.
© 2005-2022 http://www.MarketOracle.co.uk - The Market Oracle is a FREE Daily Financial Markets Analysis & Forecasting online publication.