


Stock Market Bull is Back
Stock-Markets / Stock Markets 2012 Jan 14, 2012 - 10:55 AM GMTBy: Tony_Caldaro

 Another quiet and positive week, technically, in the US markets. For the third week in a row the market traded in a narrow range: 20 points, 20 points and 22 points this week. The last two weeks have been positive with new uptrends highs. For the week the SPX/DOW gained 0.70%, and the NDX/NAZ gained 1.05%. Foreign markets had a better week. Asian markets rose 2.4%, European markets rose 1.3% and the DJ World index rose 1.1%. Economic reports had a negative bias, with two down for every one up. On the uptick: consumer credit, import prices, consumer sentiment and the monetary base. On the downtick: wholesale/business inventories, retail sales, export prices, the WLEI, and both weekly jobless claims plus the twin deficits worsened. Overall, January has started off with a good positive bias. Next week, we’ll be watching the CPI/PPI, Industrial production and Building permits. Best to your week!
LONG TERM: bull market
Some weeks ago we anticipated the first couple of weeks in January would be the deciding factor for the ongoing bull/bear market inflection point. It certainly has been! The market, as measured by the SPX, has not advanced that much it price. Only up 2.5% for the year. While the market has continued to impulse higher, our long term technicals have greatly improved. In fact, when we review both the fundamental and technical data sets we track they appear to be in the right position for a continuation of a bull market, not a bear market.
Consumer sentiment is beginning to improve after a three decade low. Economic indicators have been rising since October, after flashing a potential recession. And, long term investor sentiment has began to rise after being quite bearish just a month ago. All three fundamental indicators are still in a bearish mode. While the economy is just beginning to improve and investors/consumers are still cautious, stock market technicals are getting quite positive. Our smart money indicator turned positive last week, and continues to improve. Market breath just made a new bull market high this week. The number of stocks above their 200 dma has made a new high, after the October low, and is now over 50%. And, the SPX monthly RSI has broken through neutral and continues to rise. It looks like the market is in the early stages of a resumption of the bull market. Usually, investor sentiment gets extremely bullish and consumers turn quite positive before a bull market starts its topping process. We are currently no where near these kinds of readings. They are both still bearish!
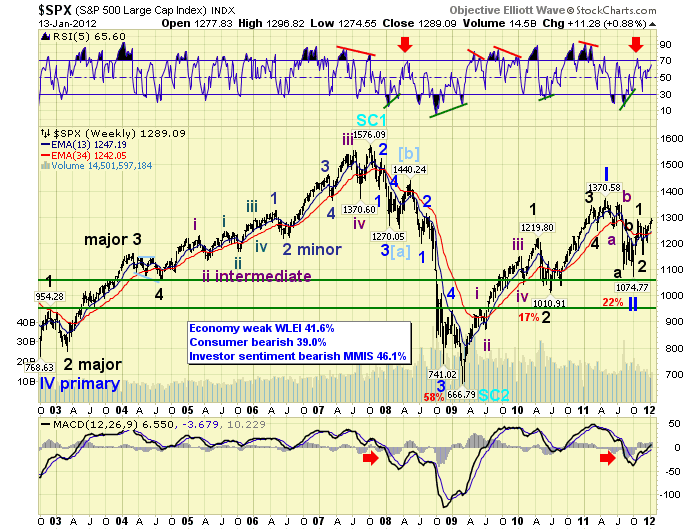
The SPX weekly chart displays our OEW count since late 2002. A Primary V wave bull market from Oct02-Oct07, ending the Supercycle, SC1, that began in Mar 1932. Then a Supercycle bear market followed, taking the form of a zigzag, as the market lost 58% of its value. Next we have the early stages, Primary waves I and II, of a five primary wave Cycle [1] bull market, starting at the SC2 low in Mar09. Observe Primary wave III is in its early stages, having completed only Major waves 1 and 2 of its five major waves. The weekly MACD has turned positive again after dropping into bearish, (below neutral), territory. The weekly RSI touched overbought during the Major wave 1 uptrend, and is heading higher, after also hitting a bearish quite oversold condition. These are all positives.
MEDIUM TERM: uptrend high SPX 1297
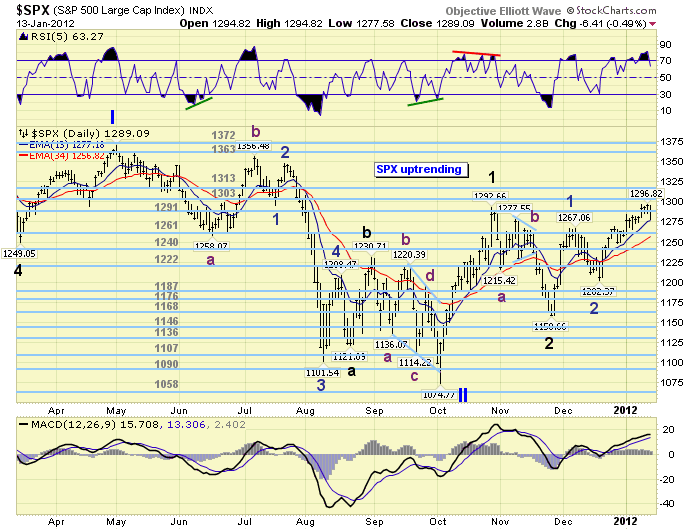
This uptrend started in late November and is now in its second month. Since May11 all trends have been one month or less, including the five waves down into the Oct11 low and Major waves 1 and 2. We have been counting the rally from SPX 1159 to 1267 as Minor wave 1. The pullback to SPX 1202 as Minor wave 2. And, the rally to SPX 1297, thus far, as Minor wave 3. If Minor wave 3 ended at the recent high, we’d expect a small pullback, not overlapping Minor 1, and then another rally to complete Minor wave 5 and the uptrend.
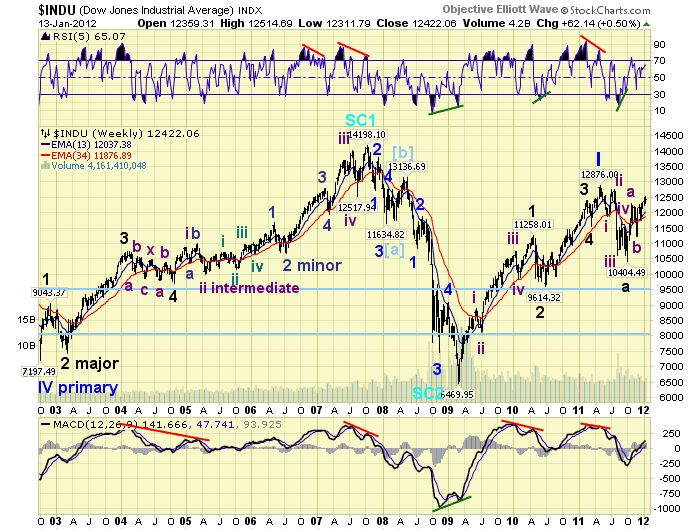
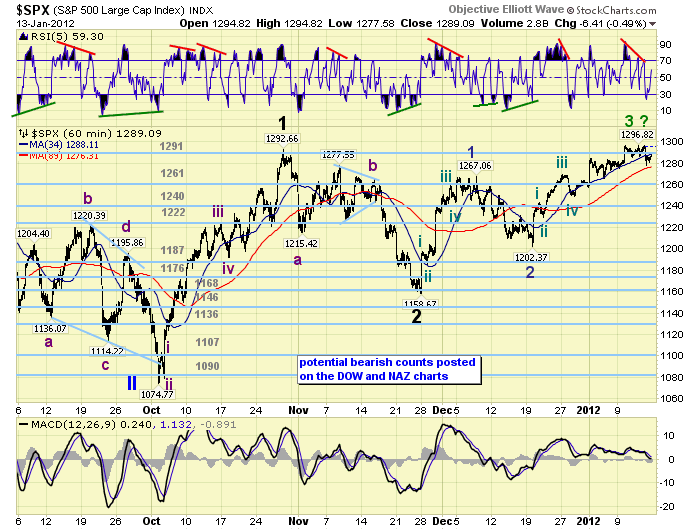
Since there is heavy resistance between SPX 1293 and 1327, we’re expecting this uptrend to be just Intermediate wave one of Major wave 3. Intermediate waves ii-iii-iv-v would then be needed to complete Major wave 3. If everything falls into place, as expected, this entire bull market, from March 2009, should challenge the all time high at SPX 1576 before it concludes. But it needs to clear the May11 high at SPX 1371 by more than one percent first. That is the historical maximum level for a bear market rally during a Primary wave II. Our alternate count posted on the DOW charts below.
SHORT TERM
Support for the SPX is at 1278, the 1261 pivot range, and then 1250. Overhead resistance is at the 1291, 1303 and 1313 pivot ranges. Short term RSI momentum displayed a negative divergence at the SPX 1297 high. Dropped to oversold when the market dropped to SPX 1278. And, was rising towards overbought on friday’s late day rally.
We counted nine waves up for Minor wave 1, with pullbacks between 11 and 17 points. We also count nine waves up for Minor wave 3, with pullbacks between 11 and 20 points. Minor wave 1 traveled 108 points, and Minor wave 3 has traveled 95 points. Thus far, the wave structure and length are about equal. Should we get a pullback over 20 points this would suggest Minor wave 4 is underway, with support at SPX 1267 or a bit higher. After that Minor wave 5, to new uptrend highs, should unfold to complete the uptrend. Thus far, we have not received confirmation of a Minor wave 3 top. So it is possible this rally can still extend higher before Minor 3 ends. Short term OEW charts have remained positive since SPX 1230, with support now around 1280. Best to your trading!
FOREIGN MARKETS
The Asian markets were all higher on the week for a net gain of 2.4%. All but China, India and Hong Kong are in confirmed uptrends.
The European markets were mostly higher on the week, England and Switzerland displaying some weakness, for a net gain of 1.3%. All but Italy are in confirmed uptrends.
The Commodity equity group were all higher on the week, gaining 1.0%. All but Russia are in confirmed uptrends.
The DJ World index has been uptrending and gained 1.1% on the week.
COMMODITIES
Bonds continue to uptrend, gaining 0.6%, and Bond prices hit new bull market highs this week. The 10YR is currently yielding 1.85%, and the 30YR 2.90%.
Crude continues its volatility losing 2.9% on the week. It is still in an uptrend and getting close to being oversold.
Gold appears to be uptrending with impulsive waves, gaining 1.5% on the week. Silver is impulsing as well.
The USD has been uptrending for six months. It gained 0.3% this week while making a new uptrend high at 81.78. The EUR lost 0.3% at new downtrend lows.
Think back for a moment. When was the last time in history we had stocks, bonds, gold and the USD all in bull markets. The mid 1940′s? During World World II. The US was the world’s safe haven then, as all USD assets and commodities were in strong demand. Then one year after the war ends stocks and commodities peaked, including gold. A year after that Bonds peaked and rates began to rise. The USD however, did not peak until around 1951. Currently we have Gold, commodities and possibly stocks peaking in 2014. Bonds peaking the year after that. But, the USD should continue its bull market until 2018. Are investors envisioning the US as the world’s safe haven again? Maybe so.
NEXT WEEK
With monday a national holiday, economic reports start on tuesday with the NY FED at 8:30. On wednesday, we have the PPI, Industrial production, and the NAHB housing index. On thursday, weekly Jobless claims, the CPI, Housing starts, Building permits, and the Philly FED. Then friday closes the week with Existing home sales. The FED has one activity scheduled. FED governor Tarullo gives Congressional testimony on the Volcker Rule on wednesday. Best to your extended weekend and week!
CHARTS: http://stockcharts.com/...
http://caldaroew.spaces.live.com
After about 40 years of investing in the markets one learns that the markets are constantly changing, not only in price, but in what drives the markets. In the 1960s, the Nifty Fifty were the leaders of the stock market. In the 1970s, stock selection using Technical Analysis was important, as the market stayed with a trading range for the entire decade. In the 1980s, the market finally broke out of it doldrums, as the DOW broke through 1100 in 1982, and launched the greatest bull market on record.
Sharing is an important aspect of a life. Over 100 people have joined our group, from all walks of life, covering twenty three countries across the globe. It's been the most fun I have ever had in the market. Sharing uncommon knowledge, with investors. In hope of aiding them in finding their financial independence.
Copyright © 2012 Tony Caldaro - All Rights Reserved Disclaimer: The above is a matter of opinion provided for general information purposes only and is not intended as investment advice. Information and analysis above are derived from sources and utilising methods believed to be reliable, but we cannot accept responsibility for any losses you may incur as a result of this analysis. Individuals should consult with their personal financial advisors.
© 2005-2022 http://www.MarketOracle.co.uk - The Market Oracle is a FREE Daily Financial Markets Analysis & Forecasting online publication.