Gold, Financial Market Safe Havens
Commodities / Gold and Silver 2012 Jan 23, 2012 - 03:06 AM GMTBy: UnpuncturedCycle
 For the last year or so there has been a lot of commentary with respect to money flows from more risky investments like stocks, commodities and gold and into the so called safe havens like the US dollar and the 30-Year Treasury. That’s the message heard day and night on Bloomberg and CNBC and they bring in one expert after another to back them up. They’ll sit there and beg the question knowing full well what the answer is going to be. It always struck me as far fetched that paper assets emitted by the world’s largest debtor, and backed by absolutely nothing, could be considered a safe haven. Meanwhile gold has been money for more than three thousand years and it is considered to be risky, speculative and down right dangerous by the gurus that fill the airwaves with their prophecies.
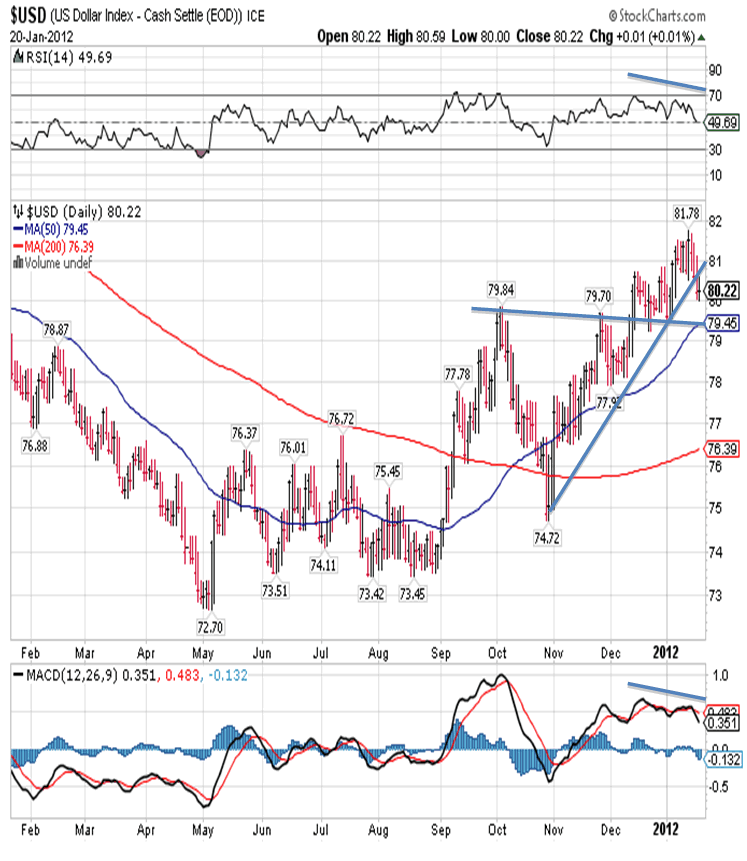
For months both the dollar and the bond have been on the rise in spite of QE2, and the more recent stealth QE3 where the Fed issued US $600 billion in swaps with the EU, who then loaned that money to EU banks, who in turn bought EU sovereign debt. If I’m not mistaken the EU got into trouble in the first place because of too much sovereign debt, so now they are going to issue more using American money. Is anyone out there familiar with the term sucker? I now believe that the FX market realizes that the Fed has gone too far, and will probably go a lot further down a very bad road. That means that we very well might have seen a top in the dollar and it is beginning to discount the inevitable.

In spite of a new high of 81.78 posted on Friday January 13th, there was no confirmation of the high by the RSI, MACD or the histogram. This week saw a continual decline in the US dollar and a break and close below the bottom band of a trend line that goes back to the late October low. This is not the final nail in the coffin, but it is a nail nonetheless. The key as to whether or not the dollar can continue to move higher will be its ability to hold above the support line that connects the last two significant highs and currently comes in around 79.62. Also, I will be very interested to see just what if any fiat currency will rally against the US dollar. This is a relevant question since we all have to carry some sort of paper in our pocket. My bet is that the Swiss Franc has bottomed and will begin its climb higher in spite of intervention from the Swiss central bank.
One more thing and it’s perhaps the most important observation of all. For more than a year we’ve seen a move away from the US dollar as a means of settling international trade. It started with small pacts between China and Brazil and China and Venezuela. Then it spread to Venezuela with Iran and China with Iran. All of these agreements had one thing in common: they would settle trade between the two nations in local currencies. Then last month we saw an agreement between China and Japan to do the same thing, and that involves a significant amount of money between two of the largest trading nations in the world. Finally it was announced earlier this week that China is negotiating trade agreements with several Middle Eastern countries (think oil) to carry out all trade in local currencies. That means oil will no longer be priced in dollars and that is huge. That will be a stake through the heart of the US dollar and it will drive the US Dollar Index down below the old historical low at 72.90 and eventually into the gutter.
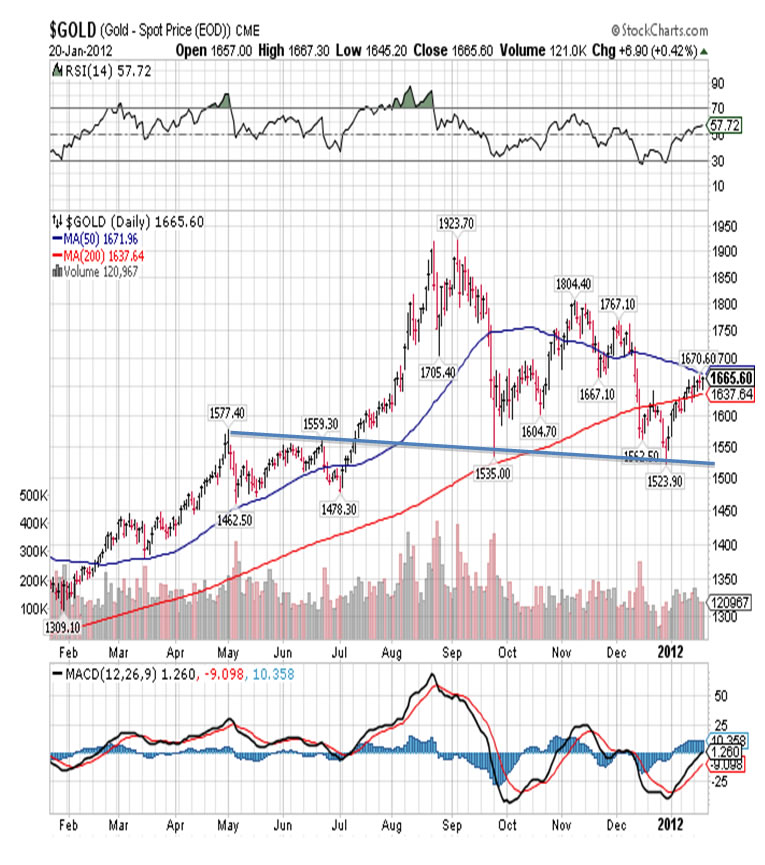
Another thing I am certain about is that gold bottomed three weeks ago at 1,523.90 as seen here and is now headed higher:

The December 29th low came ninety days after it hit an all-time closing high of 1,900.10; a high that brought with it extremely overbought conditions. The December 29th low was a second test of a support line that I’ve been drawing since we broke out above it in July of last year, and it was also a test of strong Fibonacci support at 1,522.10. Finally it was our second wave down from a lower high and percentage wise was equal to the first wave decline down from the all-time high. With respect to the here and now, gold continued to rally this week in spite of attempts to sell it off every morning as New York opens for business. Friday was more of the same as spot gold traded as low as decent support at 1,645.50 in the morning only to close up 6.90 at 1,665.60 and that is marginally above strong resistance at 1,665.20, and a sign of good strength to say the least.
Gold has a lot of reasons to rally and the some of them are even more important that a probable top in both the dollar and bond:
- Most of the major central banks are now net buyers of gold.
- China’s economy is slowing and both real estate and their stock market are declining. This will drive them into gold since it has been a traditional store of wealth for them for more than two millennia.
- You can call it what you want but Greece is going to default, the first of several I might add, and since 90% of all derivatives tied to sovereign debt are underwritten by US banks it will be a huge shock to the US financial system.
- Europe is doing nothing to solve their financial problems, except create more debt. They treat the symptoms rather than the cause.
- Sooner or later Iran will be real a problem and both Russia and China have stated that they will not allow Iranian oil to fall into US hands.
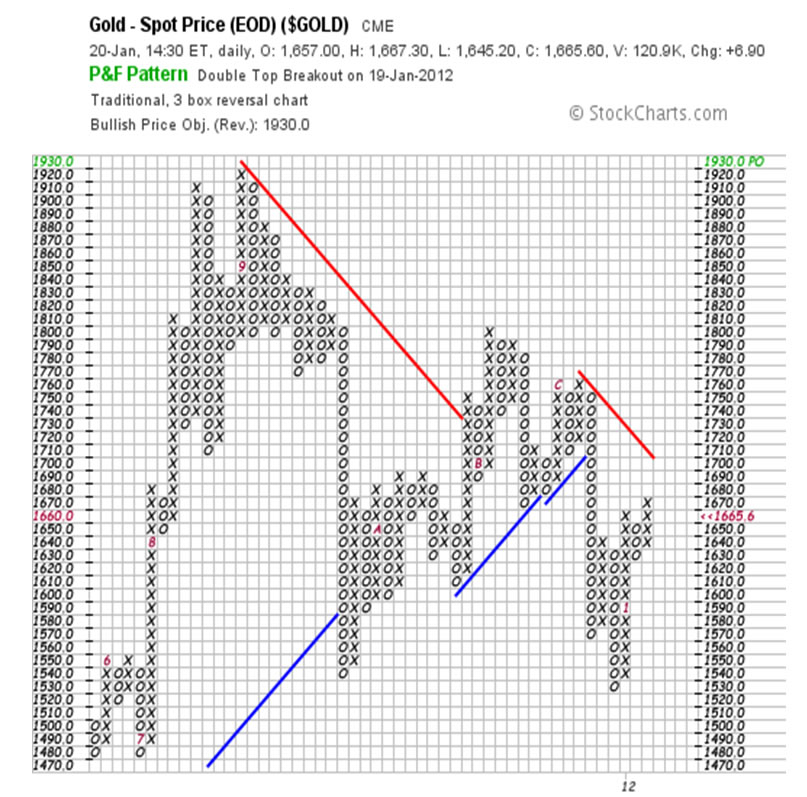
I could go on but I think you get the idea. Here you have a chart that traces movement from the all-time intraday high to date:

I have drawn in one line and it is the only line that matters. This line runs from the all-time intraday high down and touches other lower highs. Although difficult to see it currently comes in at 1,680.00 and that is only 14.40 away from Friday’s close. At the very least I think we’ll see a test of that line sometime this week and we should be trading above it by the end of the month. After that the next resistance will come from the old lower high at 1,767.10 and so on up the ladder we’ll go.

I am absolutely convinced that gold has bottomed and the Point & Figure chart agrees with me. That means higher prices but that’s a result. What’s important is to understand the cause of the coming higher prices. I have yet to see this anywhere else but I believe the bottom we saw in late December is of extreme importance as it represents the transition from the second phase of the bull market on into the third phase. We saw a similar transition at 475.00 as gold moved from the first phase on into the second phase, and it went relatively unnoticed until well after it happened. Today we see the same thing.
The third phase is important because that’s where the general public begins to invest in gold. That means it will also be the most lucrative phase. Slowly at first like the initial crack in a dam, but eventually it will be a flood and it will drive the price much higher than anyone could have imagined. There will of course be corrections, they will be short (days or weeks, not months), but they will be violent. How high is high? Gold will go to no less that US $4,000.00 and those are today’s dollars. It would probably be wiser to say that gold is going to CHF 4,000.00, and it could go a lot higher. That’s why I continually tell clients to buy gold and silver right now. If I’m right and gold goes to 4,000.00 what does it really matter if I bought at 1,665.00, or 1,645.00, or even 1,600.00 for that matter? The truth is that there will only be two kinds of people in a couple of years: those lucky few who own gold, and everybody else. Ask yourself on which side of that argument you want to find yourself on.
Giuseppe L. Borrelli
www.unpuncturedcycle.com
theunpuncturedcycle@gmail.com
Copyright © 2012 Giuseppe L. Borrelli
- All Rights Reserved Disclaimer: The above is a matter of opinion provided for general information purposes only and is not intended as investment advice. Information and analysis above are derived from sources and utilising methods believed to be reliable, but we cannot accept responsibility for any losses you may incur as a result of this analysis. Individuals should consult with their personal financial advisors.
© 2005-2022 http://www.MarketOracle.co.uk - The Market Oracle is a FREE Daily Financial Markets Analysis & Forecasting online publication.


