


Stock Market Pullback Likely This Week
Stock-Markets / Stock Markets 2012 Jan 29, 2012 - 03:17 AM GMTBy: Toby_Connor

 US markets made a new uptrend high on thursday, but ended the week mixed. For the week the SPX/DOW were -0.20%, and the NDX/NAZ were +1.05%. Foreign markets were higher: with Asia +1.5%, Europe +0.7% and the DJ World index +1.2%. Economic reports were quite mixed with negatives outpacing positives 6 to 5. On the downtick: pending/new homes sales, durable goods, leading indicators, the M1 multiplier, and weekly jobless claims rose. On the uptick: FHFA housing prices, consumer sentiment, the monetary base, the WLEI and the GDP. Next week we will get reports on Case-Shiller, the Chicago PMI, ISM and nonfarm Payrolls.
LONG TERM: bull market
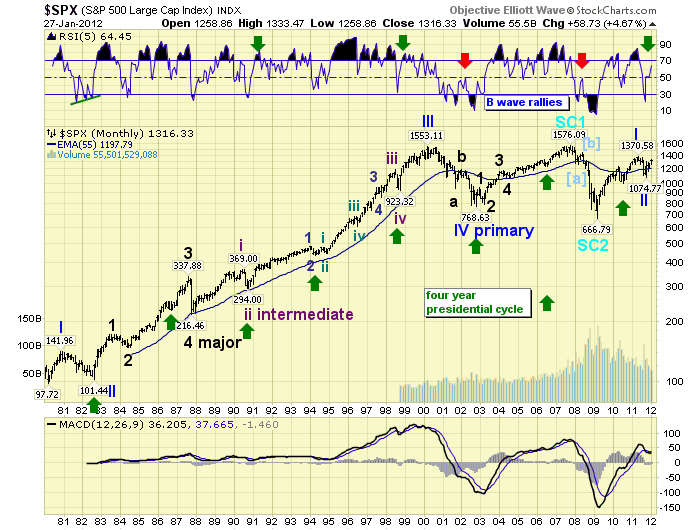
We continue to observe technical improvement supporting a bullish outcome to the second half correction of 2011. The three wave advance from early October looks impulsive, is not showing any tendencies of a bear market B wave rally, and just thursday the SPX was only 2.8% below its May 2011 Primary wave I high and the DOW was less than 0.2% below its high. The monthly chart below displays a rising RSI which looks similar to the 1990 and 1998 advances, and not the 2002 and 2008 bear market rallies.
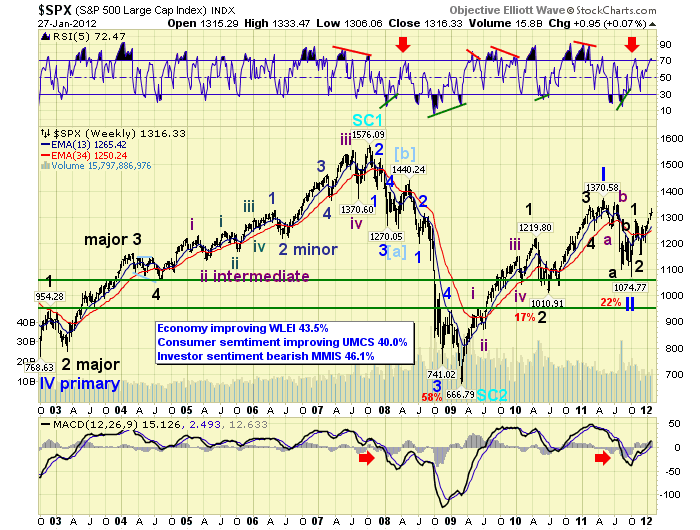
The weekly chart is displaying bullish characteristics as well. With the RSI hitting overbought and the MACD rising above neutral. Many of our other technicals indicators are bullish as well. The NYSE now has 65% of its stocks above their 200 dma, while bear market rallies usually top between 40% to 50%. Market breadth is making new bull market highs, along with five of the nine SPX sectors. The DOW displays 87% of its stocks above their 200 dma, and the VIX continues to decline in the second downtrend from its secondary high in early October. Volume, however, remains a bit light and will probably pick up after the SPX/DOW make new bull market highs.
Our long term count continues to suggest Primary waves I and II completed in May11 and Oct11, at SPX 1371 and 1075 respectively. Primary wave III has been underway since that October low. Primary III should consist of five Major waves with waves 1 and 2 already completed, and Major wave 3 underway now.
MEDIUM TERM: uptrend high SPX 1333
The daily chart displays Major waves 1 and 2, off the SPX 1075 Primary II low. Major 1 topped in October at SPX 1293, and Major 2 bottomed in November at SPX 1159. The current uptrend, from the SPX 1159 low, is taking a lot more time to unfold. Its first important rally was to SPX 1267, which we labeled Minor 1. Next a pullback to SPX 1202, which we labeled Minor 2. Then a gradual rising wave to thursday’s SPX 1333 high, which we’re labeling Minor wave 3. Nearing that high the market hit extremely overbought and RSI momentum has started to decline. With Minor 1 travelling 108 SPX points, (1159-1267), and Minor wave 3 already 131 points, (1202-1333), it may be time for a Minor wave 4 pullback. Then a Minor wave 5 to new uptrend highs.
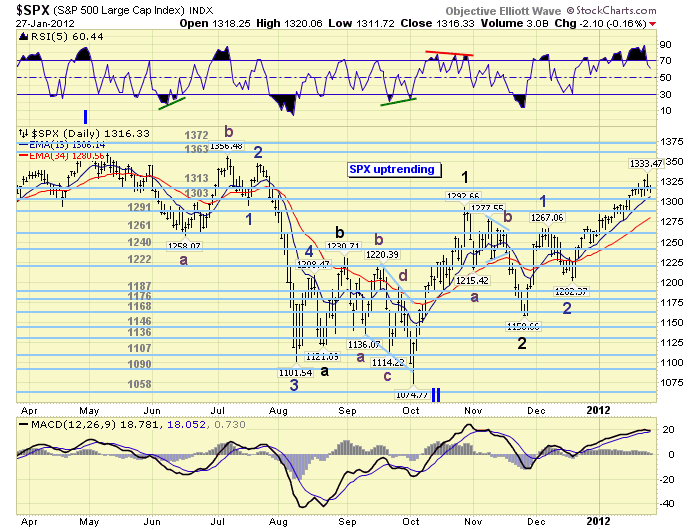
While Minor 1 only took nine smaller waves, five Minute waves, to unfold. Minor wave 3 has taken 17 smaller waves, five Minutes waves, to unfold. The longer a wave takes to unfold the more complex its underlying pattern. Should Minor wave 4 be underway now we would expect about a 50 point pullback from the SPX 1333 high. This would represent a 38.2% retracement of Minor wave 3, while Minor wave 2 retraced a larger 61.8% of Minor 1. And, since Minor wave 2 took two weeks to unfold in a complex pattern. We would expect Minor 4 to take about one week to unfold in a simple pattern. This would be wave alternation at work. Maximum downside support would be around SPX 1267.
SHORT TERM
Support for the SPX remains at the 1313, 1303 and 1291 pivots, with resistance at SPX 1327, 1347 and the 1363 pivot. Short term momentum ended the week rising to neutral from an oversold condition. Our very short term count from the Minor 2 low at SPX 1202 displays: Minute wave i, (1243), Minute ii, (1230), Minute iii, (1297), Minute iv, (1278), and potentially Minute v, (1333). This pattern displays that Minute iii was 1.618 Minute i, and Minute v is nearly 0.618 Minute waves i thru iii. During this entire six week advance the largest pullback was 20 points. After thursday’s SPX 1333 high the market pulled back 21 points to 1312 on friday. This suggests a larger wave, or Minor wave 4, is underway.
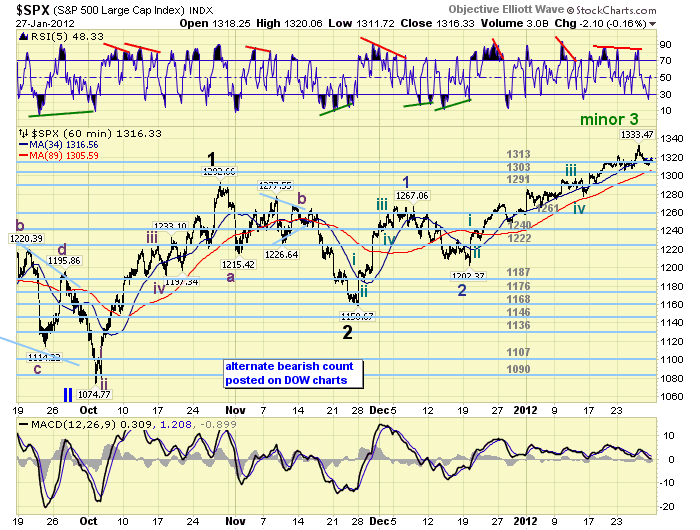
The technicals currently support this view. There are negative divergences up to the hourly charts, and declining momentum on the daily chart. As noted above, a pullback now to the lower end of 1291 pivot’s range would fit the uptrend pattern quite well. Then a Minor wave 5 should start taking this uptrend to higher highs. A decline into the lower end of the 1313 pivot range would be additional evidence Minor wave 4 was underway. Should the market rally above SPX 1333 before a Minor 4 unfolds, then it is likely Minute wave v is extending. Should the market drop below the 1291 pivot range, (1284-1298), then it should find support at the upper range of the 1261 pivot. Best to your trading!
FOREIGN MARKETS
The Asian markets were all higher on the week, gaining 1.5%, with the exception of China which was closed for the New Year. China has not confirmed an uptrend.
The European markets were mostly higher on the week gaining 0.7%. All indices are in uptrends.
The Commodity equity group were all higher gaining 2.2%. All are uptrending.
The uptrending DJ World index gained 1.2% on the week.
COMMODITIES
Bonds strengthened after the FOMC meeting, remain in an uptrend, and gained 1.2% for the week.
Crude is still uptrending gaining 1.3% on the week.
Gold is close to confirming its uptrend, Silver and Platinum already have, and gained 4.1% on the week.
The USD continues to weaken losing 1.7% on the week. The EUR gained 2.2%, and the Yen (+0.4%) remained in an uptrend despite some recent weakness.
NEXT WEEK
Busy economic calendar ahead this week. Monday kicks it off with Personal income/spending and PCE prices at 8:30. On tuesday: Case-Shiller, the Chicago PMI and Consumer confidence. Wednesday we have the ADP index, ISM manufacturing, Construction spending, and Auto sales. On thursday: weekly Jobless claims and Q4 Productivity. Then on friday the Payrolls report, Factory orders and ISM services. The FED has one extra activity scheduled: FED chairman Bernanke’s congressional testimony on thursday at 10:00. Best to your weekend and week!
CHARTS: http://stockcharts.com/...
http://caldaroew.spaces.live.com
After about 40 years of investing in the markets one learns that the markets are constantly changing, not only in price, but in what drives the markets. In the 1960s, the Nifty Fifty were the leaders of the stock market. In the 1970s, stock selection using Technical Analysis was important, as the market stayed with a trading range for the entire decade. In the 1980s, the market finally broke out of it doldrums, as the DOW broke through 1100 in 1982, and launched the greatest bull market on record.
Sharing is an important aspect of a life. Over 100 people have joined our group, from all walks of life, covering twenty three countries across the globe. It's been the most fun I have ever had in the market. Sharing uncommon knowledge, with investors. In hope of aiding them in finding their financial independence.
Copyright © 2012 Tony Caldaro - All Rights Reserved Disclaimer: The above is a matter of opinion provided for general information purposes only and is not intended as investment advice. Information and analysis above are derived from sources and utilising methods believed to be reliable, but we cannot accept responsibility for any losses you may incur as a result of this analysis. Individuals should consult with their personal financial advisors.
© 2005-2022 http://www.MarketOracle.co.uk - The Market Oracle is a FREE Daily Financial Markets Analysis & Forecasting online publication.