


Stock Market Weekend Update
Stock-Markets / Stock Markets 2012 Feb 05, 2012 - 06:38 AM GMTBy: Tony_Caldaro

 The US market opened the week on a down note, dropping to SPX 1300, but ended at new uptrend highs, SPX 1345. For the week the SPX/DOW were +1.90%, and the NDX/NAZ were +2.95%. Asian market were mostly higher, gaining 0.6%. European markets were all higher, gaining 2.8%, and the DJ World index was up 2.4%. Positive economic reports for the week outpaced negative reports 11 to 6. On the downtick: personal spending, Case-Shiller, the Chicago PMI, consumer confidence, the ADP index and factory orders. On the uptick: auto sales, personal income, PCE prices, ISM manufacturing/services, construction spending, monthly payrolls, the WLEI, investor sentiment, plus both weekly jobless claims and the unemployment rate improved. Next week’s reports will be highlighted by consumer credit, the twin deficits and consumer sentiment. Best to your weekend/week!
LONG TERM: bull market
This week the SPX neared its May11 bull market high of 1371, (1345), the DOW came within seven points of its May 11 12,876 high, and the NDX/NAZ hit their highest level in over 11 years. The stock market is beginning to look more and more like a bull market. Our monthly RSI indicator has hit overbought. This is typical for a bull market advance.
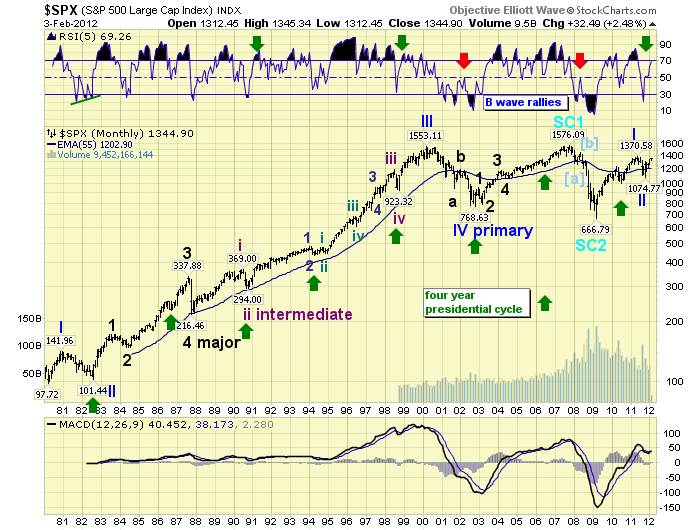
Our weekly chart is now displaying a quite overbought RSI, plus the MACD is rising and above neutral. Additional signs of bull market activity. Our count from the Supercycle bear market low in March 2009 at SPX 667 remains unchanged. A five Major wave advance, with a detailed Major wave 1, into a Primary I high in May 2011 at SPX 1371. Then a five month, elongated flat, decline into the October 2011 low at SPX 1075. After that Primary wave III began with Major wave 1 completing at SPX 1293, and a Major wave 2 low at SPX 1159 in November. Major wave 3 began at that low.
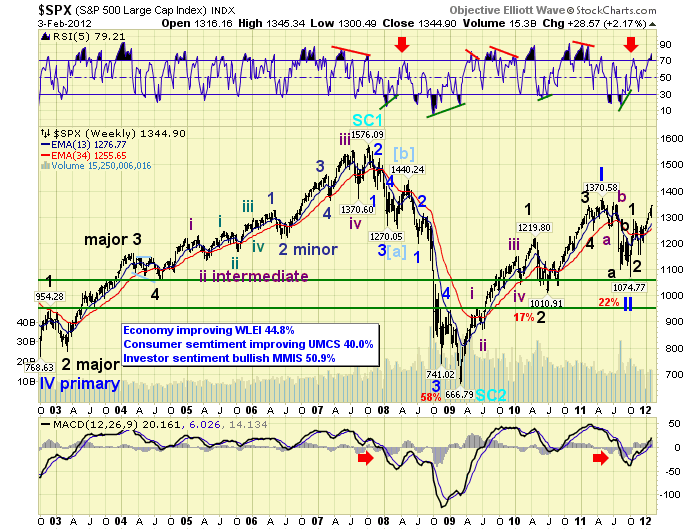
When we first started tracking the current uptrend, we anticipated the SPX would run into significant resistance between 1313 and 1327. As a result we started labeling this wave as Intermediate wave i, of Major wave 3. Now that the SPX has cleared that resistance zone it is possible this uptrend could be Major wave 3 in its entirety. We will not know for certain until after the next correction/downtrend. The reason we mention this now is because this uptrend is reaching an important natural fibonacci resistance level. At SPX 1377 this uptrend will equal the first uptrend off the Primary wave II low: Major 1. A level to keep in mind when we cover the fibonacci relationships for the current uptrend in the short term section.
MEDIUM TERM: uptrend high SPX 1345
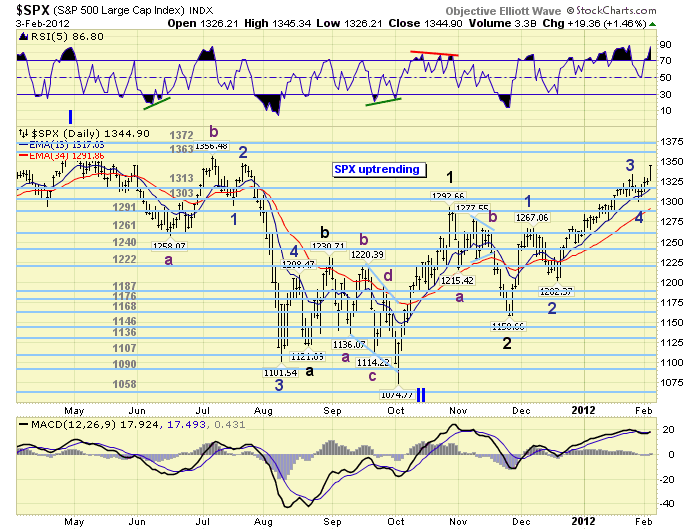
The current uptrend began in November at SPX 1159. Thus far it has completed four Minor waves: wave 1 SPX 1267, wave 2 SPX 1202, wave 3 SPX 1333 and wave 4 SPX 1300. Wave 5 is underway now. While Minor wave 2 retraced 61.8% of Minor 1 and took two weeks. Minor wave 4 only retraced a bit more than 23.6% of Minor 3 and took only two days. Both Minor waves 2 and 4 display the largest pullbacks of the entire uptrend: 65 and 33 points respectively.
Reviewing the market internals we find market breadth making new highs, seven of the nine SPX sectors still in uptrends, 74% of NYSE stocks above their 200 dma, and the VIX downtrending. No signs of an impending uptrend high at the moment. In fact, 19 of the 20 world markets we track are in confirmed uptrends too. However, since we have completed four waves, and are currently in the fifth, we should be looking for an uptrend high in the coming weeks.
SHORT TERM
Support for the SPX remains at 1313 and then 1303, with resistance at 1363 and then 1372. Short term momentum ended the week extremely overbought. As you can observe in the chart below, we counted five Minute waves during Minor waves 1 and 3. Minute waves iii and v subdivided during Minor waves 1 and 3, but Minute wave i was simple. We have already labeled the first rally from SPX 1300 to 1321 as Minute wave i of Minor wave 5, and the pullback to SPX 1307 as Minute wave ii. The rally off that low is Minute wave iii. When it completes, and Minute waves iv and v complete, this entire uptrend should end. The time factor, for this bull market, would suggest an uptrend high some time this month. The price factor follows.
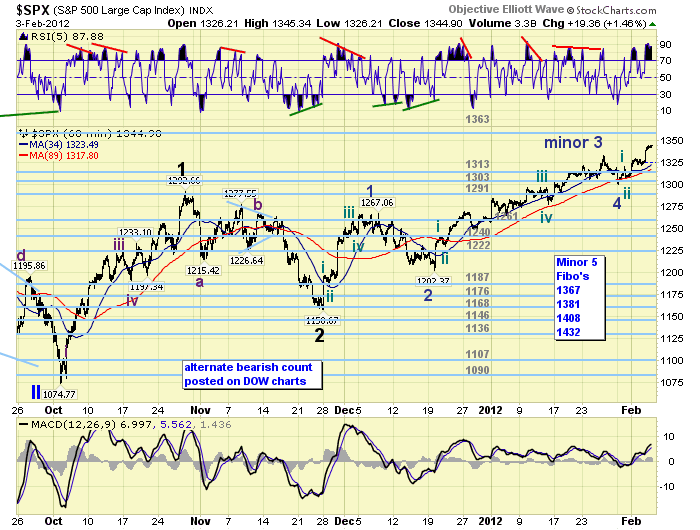
As we noted in the long term section, this uptrend will equal the first uptrend at SPX 1377. This is a comparison of two complete waves to each other. Now let’s compare the internal waves of this uptrend to each other. At SPX 1367 Minor 5 = 0.618 Minor 1, at SPX 1381 Minor 5 = 0.618 Minor 3, at SPX 1408 Minor 5 = Minor 1 and 0.618 of Minor waves 1 through 3, at SPX 1432 Minor 5 = Minor 3. All these fibonacci relationships give us these potential levels: SPX 1367, 1377/81, 1408 and 1432. We also have OEW pivots at 1363, 1372, 1386 and then 1440. The pivots fit quite well, not surprising, with the fibonacci relationships except for SPX 1408. We can now conclude the next area of significant resistance is between the OEW 1363, 1372 and 1386 pivot ranges. With an outside chance at SPX 1408 and the OEW 1440 pivot. Since the market closed at SPX 1345 it can still gain a few percent before running into the first resistance cluster.
Short term support is at SPX 1333, 1320 and the OEW 1313 pivot. Overhead resistance is at SPX 1345/47, then the OEW 1363 and 1372 pivots. Short term momentum is extremely overbought, which suggests a pullback soon. The short term OEW charts remain positive from SPX 1313 with support around 1323. With very few economic reports next week the market is likely to be technically driven. Best to your trading!
FOREIGN MARKETS
The Asian markets were mostly higher on the week for a net gain of 0.6%. All but Australia remain in uptrends.
The European markets were all higher on the week for a net gain of 2.9%. All indices we track remain in uptrends.
The Commodity equity group were all higher on the week for a net gain of 2.9%. All are in uptrends.
The DJ World index is uptrending and gained 2.4% on the week.
COMMODITIES
Bonds remain in an uptrend but lost 0.3% on the week.
Crude lost 2.1% on the week, confirmed a downtrend, but did get quite oversold short term.
Gold is uptrending, just experienced it largest pullback $37, and lost 0.2% on the week.
The USD appears to be downtrending, but ended the week flat. The EUR was down 0.5%, and the JPY was up 0.2%.
NEXT WEEK
Economic reports start on tuesday with Consumer credit. On thursday weekly Jobless claims and Wholesale inventories. Then on friday the Twin deficits and Consumer sentiment. Quite a light week. As for the FED, it’s Bernanke week! The chairman gives Senate testimony on tuesday before the Budget committee. Then on friday a speech on housing in Florida. Best to your week and weekend!
CHARTS: http://stockcharts.com/...
http://caldaroew.spaces.live.com
After about 40 years of investing in the markets one learns that the markets are constantly changing, not only in price, but in what drives the markets. In the 1960s, the Nifty Fifty were the leaders of the stock market. In the 1970s, stock selection using Technical Analysis was important, as the market stayed with a trading range for the entire decade. In the 1980s, the market finally broke out of it doldrums, as the DOW broke through 1100 in 1982, and launched the greatest bull market on record.
Sharing is an important aspect of a life. Over 100 people have joined our group, from all walks of life, covering twenty three countries across the globe. It's been the most fun I have ever had in the market. Sharing uncommon knowledge, with investors. In hope of aiding them in finding their financial independence.
Copyright © 2012 Tony Caldaro - All Rights Reserved Disclaimer: The above is a matter of opinion provided for general information purposes only and is not intended as investment advice. Information and analysis above are derived from sources and utilising methods believed to be reliable, but we cannot accept responsibility for any losses you may incur as a result of this analysis. Individuals should consult with their personal financial advisors.
© 2005-2022 http://www.MarketOracle.co.uk - The Market Oracle is a FREE Daily Financial Markets Analysis & Forecasting online publication.