FTSE Forecast - ABC correction - is there more to come or not ?
Stock-Markets / UK Stock Market Jun 24, 2006 - 07:00 PM GMTBy: Nadeem_Walayat
The expected correction has occurred on cue, hitting the target of 5,500; but has moved much faster than original expectations !
So where to next ?

The original expectation was for a trend towards major support along 5,500 by Mid October 2006, but the speed of the decline has already seen the target fulfilled by June 06, more so that the pattern formed is the originally envisaged ABC decline.
Technical Analysis
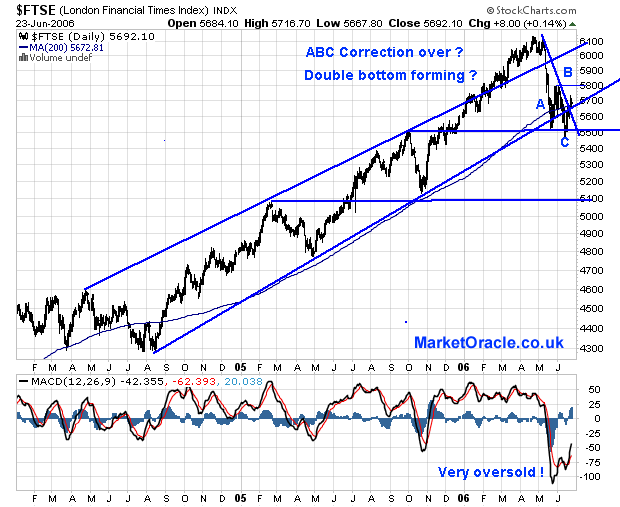
1. Price Patterns - The decline to the 5,500 target has formed a corrective ABC pattern, additionally the C wave s much milder than the B wave decline and thus suggests higher prices. The closest bullish pattern being formed is a double bottom, requiring a break above 5800 to confirm. The pattern would project a 300 point rally from 5800 or target 6100 ! On the downside, a less likely break below 5470 would see trend all the way down to between 5100 and 5150.
Resistance - As at the last short-term high of 5800 and thus marks a trigger for the end of the correction.
2. Support - Key support lies along 5500, both the previous high and recent activity.
3. MACD - (Bottom indicator) - The sharp break lower has put the MACD into a very oversold state, thus supporting the picture unfolding of a trend higher rather than lower.
4. 40 week Moving Average - The price has been moving around the 40 week Moving average, and thus finding both support and resistance. Which suggests it is likely to hug the 40 week average for some time.
5. Uptrend Line - The initial break of the trendline failed to hold and the FTSE has again crossed above it and again it will act as support, though a much weaker trendline then previously.
6. Time - The picture is confused on what the market is now likely to do time wise, it may trend higher to 6000 and then have another decline towards 5500 by Mid October or not ?
Conclusion - The picture is a little confused, but technically the market is suggesting that the correction is over and higher prices are expected.
Buy Trigger - The Primary buy trigger would be to break above the last high of 5800 which would confirm the double bottom price pattern.Target - Based on the above analysis the FTSE is targeting a move back to the 6000, as long as support holds.
Stop-Loss - The stop loss would be a distant 5,470, given the price volatility it would need to be set quite far from current price action
Nadeem Walayat
(c) MarketOracle.co.uk 2005-2006
The Market Oracle is a FREE Financial Markets Forecasting & Analysis online publication. We aim to cut through the noise cluttering traditional sources of market analysis and get to the key points of where the markets are at and where they are expected to move to next ! http://www.marketoracle.co.uk
This article maybe reproduced if reprinted in its entirety with links to http://www.marketoracle.co.uk
© 2005-2022 http://www.MarketOracle.co.uk - The Market Oracle is a FREE Daily Financial Markets Analysis & Forecasting online publication.


