


Gold Breakout and HUI Index Set to Advance to between 700 - 900
Commodities / Forecasts & Technical Analysis Feb 10, 2007 - 01:26 PM GMTBy: Clive_Maund

The title of this article was designed to get you to click on it and open it, and now that you're here, you should stick around because you are probably going to find this interesting.
In this game the most important things to observe are often the simplest - many people get lost in a quicksand of detail so that they can't see the woods for the trees, and thus end up losing sight of the big picture. So today we are going to keep it simple and to the point, which is easy because the market itself is giving us some very clear indications.
We will start by looking at the 1-year gold chart. On this chart we can see that gold's next uptrend isn't a matter of conjecture or about to begin - it has already begun. It began with the breakout from the 3-arc Fan Correction last month, which signaled the end of the corrective phase and the birth of the new uptrend. The only question now is whether it will first run back to the upper side of the third fanline, as often happens, before the nascent uptrend gets underway in earnest. This remains a possibility as it still hasn't broken above the July high, although the action late last week is greatly increasing the chances of it continuing higher from here. Once it breaks above $680 it should really get moving, and advance quickly towards last year's high at $730, which should prove to be nowhere near as serious a resistance level as the current $660 - $680 zone.
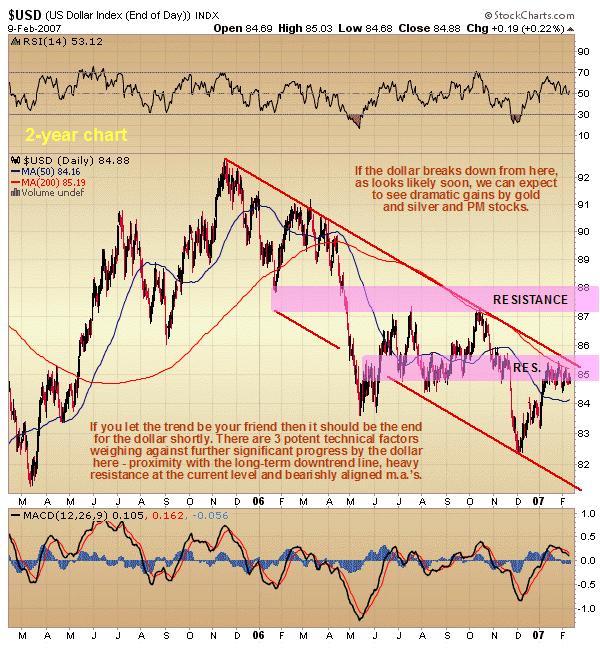
Next let's consider the dollar. Some pundits have said that gold "has broken free of the dollar" which is true up to a point - it did so in 2005 - but it can never break completely free of the currency it is priced in. If that drops, gold and silver are going to get a big boost. Looking at the 2-year chart for the dollar index it is clear that if you are the type who enjoys swimming against a strong current, then being long the dollar here will be an irresistible challenge.
For others who like an easier life and prefer to "go with the flow" it's an obvious short. It has 3 potent technical factors working against further significant progress at this juncture. After its recent strong gains it is now close to the upper boundary of its long-term downtrend channel, a point where we would it expect it to roll over and head south again. It is currently churning in a zone of heavy resistance that is likely to reverse the intermediate trend from up to down in the near future, and finally it is in the vicinity of its bearishly aligned moving averages, although the 50-day moving average could soon turn up, another normal point for resumption of the downtrend. There is scope for it to make a run at the trendline, which would be the occasion for a modest reaction in gold short-term, but this would only delay a little the expected new intermediate downtrend in the dollar.
Now we come to the main point of this article which is to bring to readers' attention the magnitude of the potential upside in Precious Metals stocks. To do this we will use a 7-year log chart for the HUI index, which encompasses the entire bull market to date. The initial uptrend, shown by the pale blue line, was too steep to be sustainable, and the index thus broke this line in 2004 and went into a rectangular consolidation pattern, before a more sustainable uptrend resumed.
The long-term uptrend drawn on this chart immediately makes 2 things clear. Firstly, if this trend channel is operative, and the higher low last month, coupled with the gold fanline breakout and the bearish looking dollar chart strongly suggest that it is, then we are close to an optimum buying area with the index still being relatively close to the lower boundary of the uptrend channel.
 |
$24 (31% discount) |
The other point is that the upside is enormous - if the index embarks on a major uptrend that results in it making contact with the upper boundary of the channel again, then we are looking at it rising to the 700 - 900 area, perhaps higher, depending on when it meets it. Sound outrageous? - if you had told people at the end of 2000 that this index would rise by over 600% in the following 3 years, they would have sent for the men in white coats. In the light of this the potential gains mentioned here sound rather conservative. On the downside, a general sell signal for Precious Metals stocks would be generated not by a break below the channel line, but by a break below the support level at and above 270.
In recent weeks on www.clivemaund.com we have reviewed the large gold and silver stocks traded on US markets, and shortly we will be looking at a range of the best trampled down junior stocks. Most junior stocks have suffered terrible damage during the corrective phase in force from May last year, that is now over, and many of their charts look like Berlin in 1945. There are amazing bargains to be had, with the cream of the juniors showing strong accumulation patterns as Smart Money has been mopping them up like there's no tomorrow. Shouldn't be long now...
By Clive Maund
CliveMaund.com
The above represents the opinion and analysis of Mr. Maund, based on data available to him, at the time of writing. Mr. Maunds opinions are his own, and are not a recommendation or an offer to buy or sell securities. No responsibility can be accepted for losses that may result as a consequence of trading on the basis of this analysis. Mr. Maund is an independent analyst who receives no compensation of any kind from any groups, individuals or corporations mentioned in his reports. As trading and investing in any financial markets may involve serious risk of loss, Mr. Maund recommends that you consult with a qualified investment advisor, one licensed by appropriate regulatory agencies in your legal jurisdiction and do your own due diligence and research when making any kind of a transaction with financial ramifications.
© 2005-2022 http://www.MarketOracle.co.uk - The Market Oracle is a FREE Daily Financial Markets Analysis & Forecasting online publication.