Crude Oil and Natural Gas Bottoming?
Commodities / Crude Oil Mar 16, 2012 - 03:25 AM GMTBy: Mike_Paulenoff
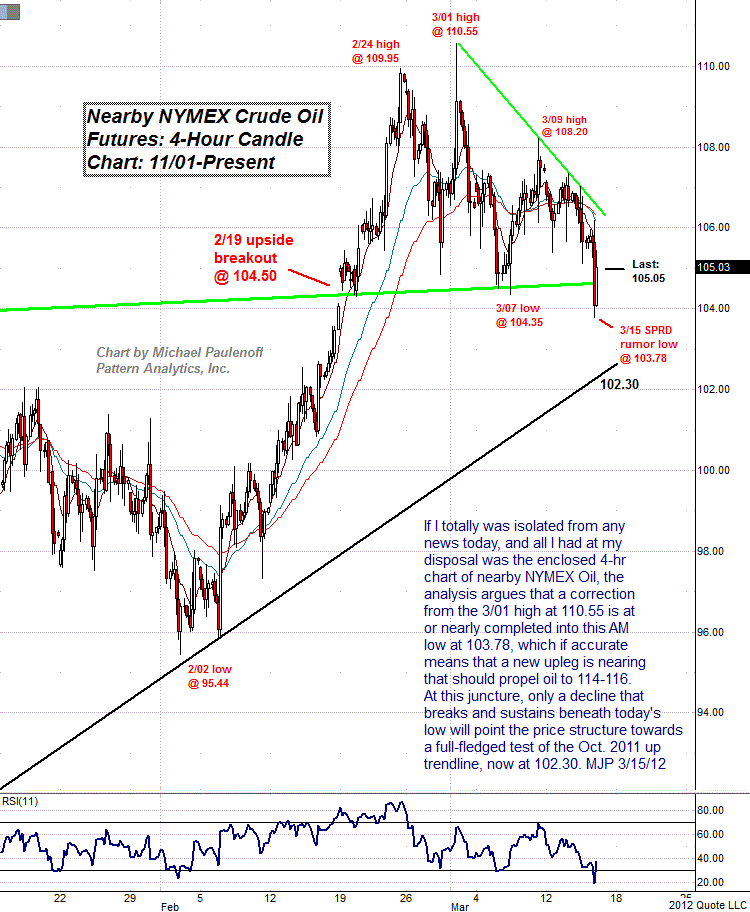
If I totally was isolated from any news today, and all I had at my disposal was the enclosed 4-hr chart of nearby NYMEX Oil, the analysis argues that a correction from the March 1 high at 110.55 is at or nearly completed into this morning's low at 103.78.
If accurate, this means that a new upleg is nearing that should propel oil to 114-116. At this juncture, only a decline that breaks and sustains beneath today's low will point the price structure towards a full-fledged test of the October 2011 up trendline, now at 102.30.

Sign up for a free 15-day trial to Mike's ETF & Stock Trading Diary today.
By Mike Paulenoff
Mike Paulenoff is author of MPTrader.com (www.mptrader.com), a real-time diary of his technical analysis and trading alerts on ETFs covering metals, energy, equity indices, currencies, Treasuries, and specific industries and international regions.
© 2002-2012 MPTrader.com, an AdviceTrade publication. All rights reserved. Any publication, distribution, retransmission or reproduction of information or data contained on this Web site without written consent from MPTrader is prohibited. See our disclaimer.
Mike Paulenoff Archive |
© 2005-2022 http://www.MarketOracle.co.uk - The Market Oracle is a FREE Daily Financial Markets Analysis & Forecasting online publication.


