


Stock Market Two Month Top in Place?
Stock-Markets / Stock Markets 2012 Apr 09, 2012 - 05:52 AM GMTBy: Andre_Gratian

 Current Position of the Market
SPX: Very Long-term trend - The very-long-term cycles are down and, if they make their lows when expected (after this bull market is over) there will be another steep and prolonged decline into late 2014. It is probable, however, that the steep correction of 2007-2009 will have curtailed the full downward pressure potential of the 120-yr cycle.
SPX: Intermediate trend - The intermediate uptrend is still intact, but a short-term top may already have started to take shape.
Analysis of the short-term trend is done on a daily basis with the help of hourly charts. It is an important adjunct to the analysis of daily and weekly charts which discusses the course of longer market trends.
Market Overview
The topping pattern which had been underway for the past three weeks appears to be complete. For the last two days, the 1390 level was challenged repeatedly intra-day, but held. On Friday morning, after a disappointing jobs report, futures dropped 15 points during their two-hour session. This is the equivalent of about 1383 on the cash index and below short-term support. Should Monday's opening be at that level or lower, we can assume that the decelerating pattern of the past three weeks has ended in a short-term top and that the first meaningful correction since 1159 is under way.
While the lower than expected jobs figure will get the credit for this sell-off, cycle analysts will look to the bottoming 8-wk cycle as the real cause of the decline. It's ideal low was on Friday 4/6, but it could be extended to Monday or Tuesday.
There is always the possibility that the cycle will bottom over the week-end and that Monday's opening will not be as bad as Friday's action suggests. We will have to wait until next week to know for sure what the market intends but, even there is a recovery in stock prices after the cycle makes its low, there are forces at play which suggest that the trend for the foreseeable future has turned and that we have entered a corrective phase which could last until mid-June and the next cyclical low.
Point &Figure and Fibonacci projections point to 1295-1305 as a potential level where the decline will come to an end -- not lengthy enough in either time or price to be considered an intermediate-term correction. However, 1342 is also a strong contender.
The VIX should confirm the reversal in equities by breaking out of the small base which it has been forming since mid-March, mimicking in reverse the pattern that the SPX was forming with some positive divergence thrown in. The P&F chart suggests a move to about 25 from Friday's 16.70 close.
Chart analysis
"I think we can all agree that 1) the SPX is overbought and in need of a correction, and 2) there is obvious deceleration taking place, both being precursors of another interim correction in the trend that began at 1159."
This quote from last week's letter may have proven prophetic. On the Daily Chart of the SPX (below), I have approximated the decline in price by Friday's future. If, on Monday, we open at 1383 or lower, it will put prices below the trend line and the prior support level, making this the first "lower low" in the trend which started at 1159.
Earlier, I mentioned two possible targets for the end of the decline: about 1300, and 1342. Both have strong arguments in their favor which are based on P&F and Fibonacci projections, so we'll have to let the market decide which it prefers. If the SPX has now completed 5 waves from 1159, a pull-back to 1342 would represent a return to the end of wave 4, which is a common retracement point in an uptrend.
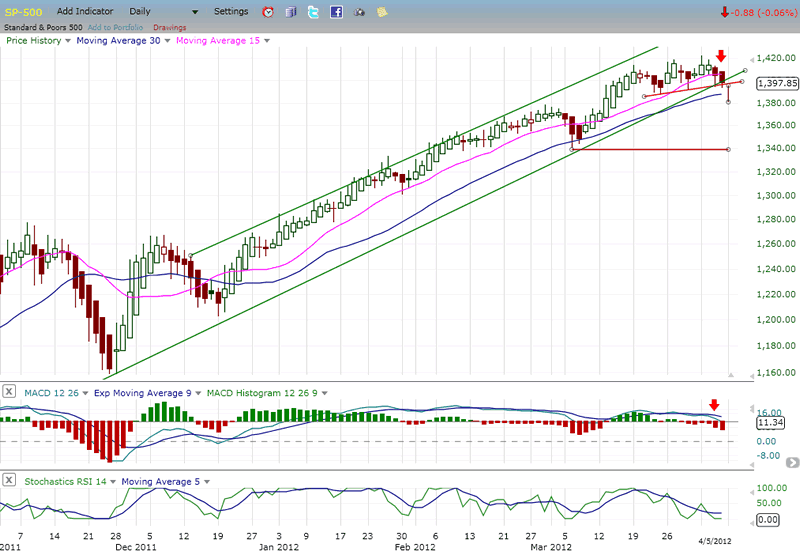
The time factor will be decided by cycles and also, in this case, by a Fib time projection. If the time which it took for the SPX to reach 1422 from 1159 is 87 trading days, then 1.618 times that distance is 141 days, which takes us to 6/15. This date corresponds to the time frame in which several short-term cycles are scheduled to make their lows - at least 5 and perhaps more. These coinciding factors would create a strong incentive for the decline to continue into early to mid-June. If it takes that long for the correction to end, it is doubtful that the decline would be limited to 1342.
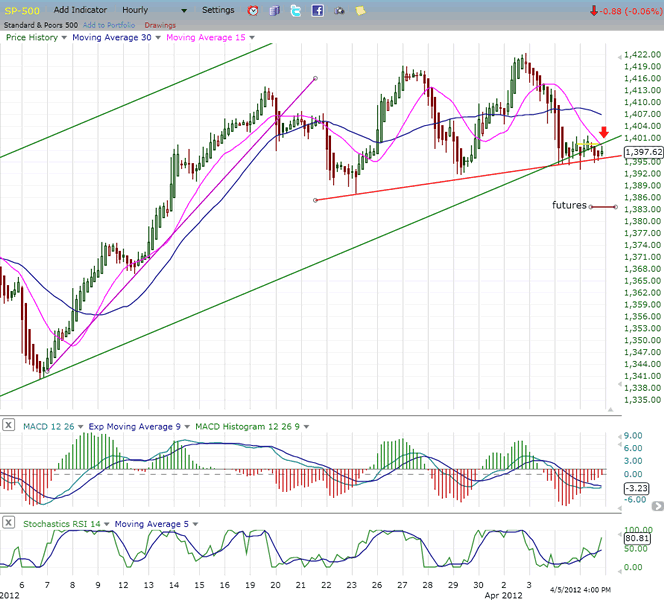
On the Hourly Chart, you can see more clearly where the futures closed Friday morning: well below the support and trend lines. The consolidation that took place above 1393 over the last two days is reflected in the oscillators which had started to move up and flatten out. Should we open down, it will send them into a new downtrend from which they will have to recover before the SPX can attempt a counter-trend rally.
You can see how the topping pattern was reflected in the behavior of the MACD which started to show negative divergence from the very first top on 3/19, and continued to do so with each subsequent top -- a strong warning that the rally was coming to an end.
There is little more to be gleaned from this chart until we see the market action on Monday.
Cycles
It is not easy to determine the influence of cycles on price, even in retrospect. I have repeatedly pointed to the 14-15 week cycle topping on 3/19. Although it did not bring prices down immediately, I have to assume that it played a role in forming the top, finally getting some assistance from the 8-week cycle to bring prices down decisively.
The 8-week cycle ideally bottomed last Friday (but could prolong its phase by one or two days) and will most likely co-ordinate its low with a P&F projection. The first of these would take the index to 1383-84, achieved on Friday by the futures. It would therefore not be surprising to see the SPX initially pause at that level. Subsequent phase counts would take it to 1380, and then 1371. Any of these levels could turn out to be the low of the 8-wk cycle.
Another short-term cycle is due on 4/17, and then 4/30. But the cluster of cycle lows which could be the aim of the decline, comes in early to mid-June.
Breadth
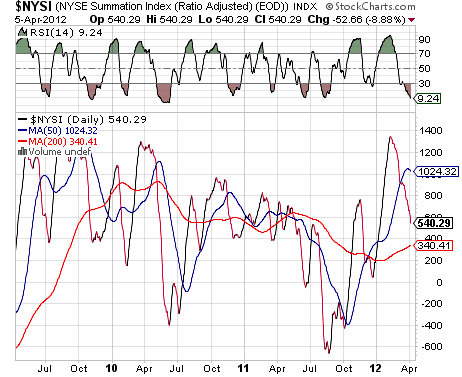
After making its highest high in nearly three years, the RSI of the NYSE Summation Index (courtesy of StockCharts.com) is now making its lowest low since June of 2010. It is now at an extremely oversold condition and cannot be expected to continue at this rate of decline. This means that after another brief plunge, it should start steadying along with prices, perhaps in conjunction with the bottoming 8-wk cycle. That does not mean that we should be looking for a straight advance from that low. The pattern may be similar to that made in the first quarter of 2011.
Sentiment
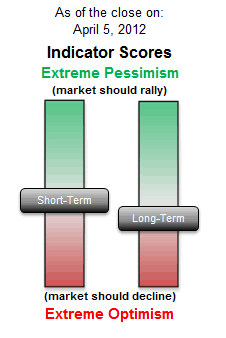
The SentimenTrader (below, courtesy of same) continues to show a bearish bias, but is not at an extreme reading, which suggests that we should not yet be at an important top. (unchanged)
VIX
Below, I have posted a 4-hr chart of the VIX. It clearly shows the base formation which was gathering strength after creating two positive divergence reversals to the SPX. Those two lows were followed by slightly higher highs, which suggested the beginning of an uptrend.
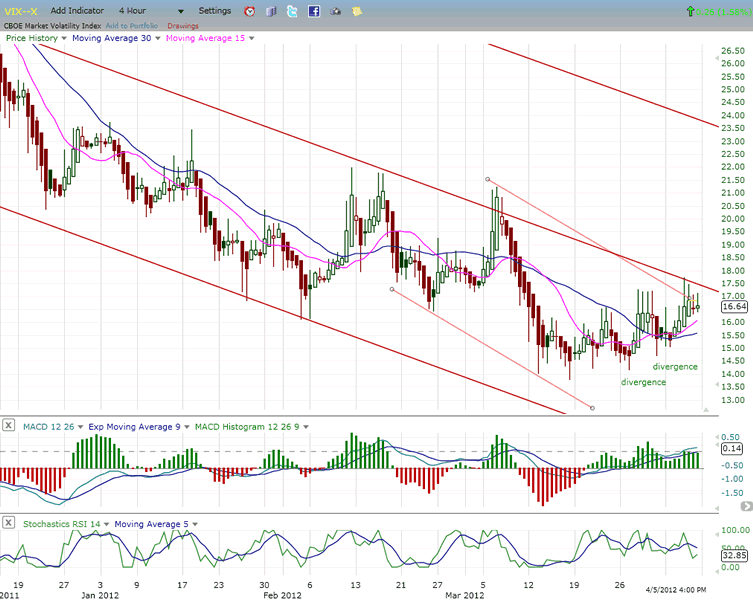
If the futures open lower, the uptrend should accelerate and the VIX should start rising toward its initial projection of 23-25.
The upper red channel line is approximately the mid-point point of the long--term down channel. Combined with the P&F projection, it could limit the move that the VIX is capable of making at this time.
Any sign that the VIX uptrend is coming to an end should be a warning that the SPX is approaching the end of its correction.
XLF (Financial SPDR)
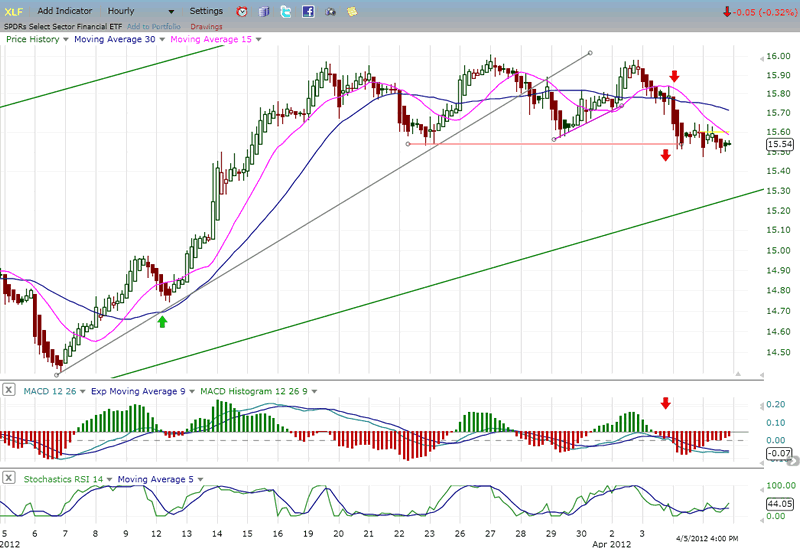
The XLF gave a hint of a top in the SPX when it failed to make a new high along with the latter on 4/2. It was not a clear enough divergence to give us a high level of confidence, but then, on Thursday, the XLF made a slightly lower low thereby producing negative divergence both at the top and at the bottom. That reinforced the notion that a top was in progress; but knowing how influential the jobs report - in conjunction with a cycle low - could be, one had no way of knowing if a low would be made on Thursday or later.
If the XLF gives a sell signal on Monday, we'll wait for signs that it is bottoming and be on the lookout for the SPX to be doing the same. There is very little distribution showing on the P&F charts of the financial indices, so this could mean that the correction will be more limited than anticipated. In the case of XLF, it could be limited to about one point.
BONDS
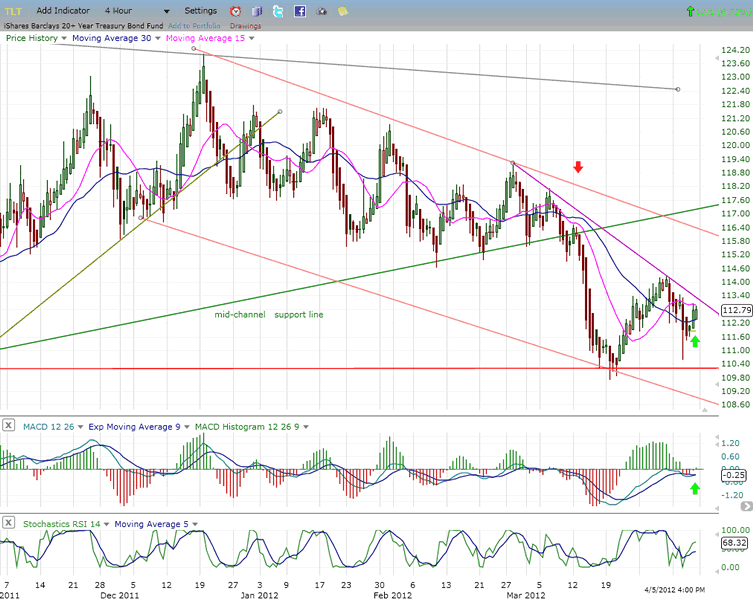
Along with equity futures being down on Friday, so were interest rates, which means that the bonds should rally on Monday, including TLT. After a period of impressive top distribution, TLT broke down and found support at a former low. Since then, it has formed a small consolidation base which has the capability of moving in it back up to 117. That would be a back-test of its broken mid-channel support line.
In the past couple of days, the TLT indicators looked as if they were getting ready for an up-move. When the index gets to its projection, it will be a good time to re-evaluate what the SPX is doing.
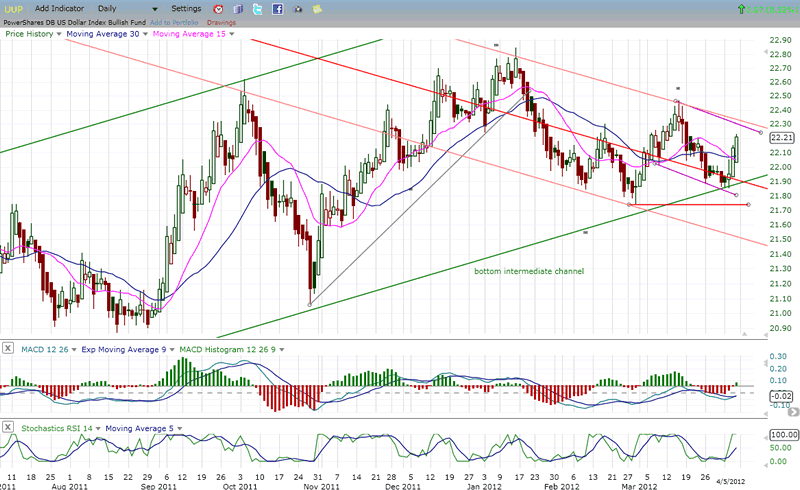
UUP (Dollar ETF) Daily Chart.
The dollar was also reported to be down on Friday, so UUP should be down on Monday, as well -- another example that the dollar does not always move contrary to the SPX.
Apparently, the dollar's place in the sun is not here, yet. It has made a base capable of carrying it higher, but has made little progress toward the fulfillment of its potential. UUP had recently broken out in what looked like another attempt at resuming its uptrend. Perhaps it was only a bounce off its lower channel trend line. We'll have to see how much of a correction takes place. It's next cycle low is due around 4/18. Even if it were to break its green trend line, chances are that it would continue to trade within the red ones.
GLD (ETF for gold)
GLD has been in a correction since 9/11. Although already 7-months long, there is no clear sign that it is over.
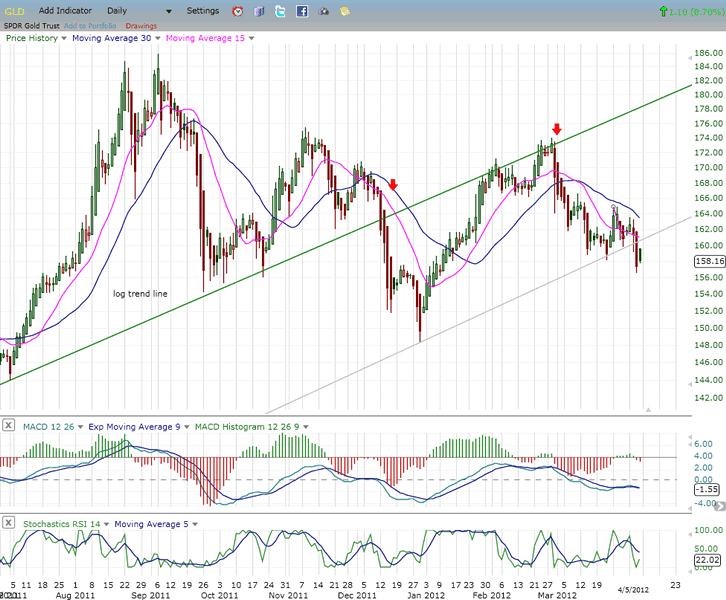
After completing a 3-wave pattern into the end of December, GLD had a good rally which turned out to be a back-test of its broken (log) trend line. It has since continued to correct, trying to hold above its 200-DMA. Last week, it closed two points below, which is not enough to be considered a negative. However, this is the second time that it has challenged its MA, and if it does not get back above it quickly, it will have a bearish connotation.
The MACD is showing some slight positive divergence and GLD must take advantage of it right away before this opportunity to reverse is lost. Since it is impossible to predict how the futures reaction to the jobs report will affect it, we need to wait until a clearer picture emerges.
The P&F chart gives it a near-term downside potential of 154 and perhaps 151.
OIL (USO)
USO fell short of reaching 44 on its rally, but could still get there after some additional consolidation. As long as it remains above 36, the count remains valid.
USO is undergoing an orderly correction and recently bounced off its lower channel line. If it has any chance of reversing soon, it must remain within the channel. Although the SRSI is oversold, there is no indication that the MACD is slowing, and that could mean lower prices.
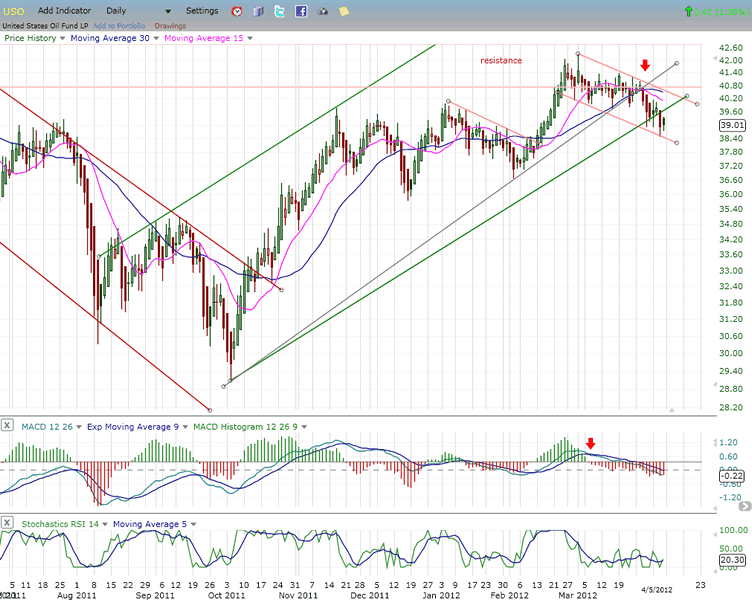
Unless the market can stabilize by Monday's opening -- something which is given slim odds -- Friday's sell-off in the futures has negative implications for oil. In this case also we'll need to wait for more clarity.
Summary
Over the past three weeks, equity indices have hinted at a short-term top. Friday's disappointing jobs report is most likely the catalyst which will start the first significant correction in the SPX since it started its uptrend from 1159.
There is a possibility that the pull-back could end at 1342. If that level does not hold, about 1300 seems likely.
Time-wise, early to mid-June would be the ideal time for the correction to come to an end.
FREE TRIAL SUBSCRIPTON
If precision in market timing for all time frames is something which is important to you, you should consider a trial subscription to my service. It is free, and you will have four weeks to evaluate its worth.
For a FREE 4-week trial. Send an email to: ajg@cybertrails.com
For further subscription options, payment plans, and for important general information, I encourage you to visit my website at www.marketurningpoints.com. It contains summaries of my background, my investment and trading strategies and my unique method of intra-day communication with Market Turning Points subscribers.
By Andre Gratian
MarketTurningPoints.com
A market advisory service should be evaluated on the basis of its forecasting accuracy and cost. At $25.00 per month, this service is probably the best all-around value. Two areas of analysis that are unmatched anywhere else -- cycles (from 2.5-wk to 18-years and longer) and accurate, coordinated Point & Figure and Fibonacci projections -- are combined with other methodologies to bring you weekly reports and frequent daily updates.
“By the Law of Periodical Repetition, everything which has happened once must happen again, and again, and again -- and not capriciously, but at regular periods, and each thing in its own period, not another’s, and each obeying its own law … The same Nature which delights in periodical repetition in the sky is the Nature which orders the affairs of the earth. Let us not underrate the value of that hint.” -- Mark Twain
You may also want to visit the Market Turning Points website to familiarize yourself with my philosophy and strategy.www.marketurningpoints.com
Disclaimer - The above comments about the financial markets are based purely on what I consider to be sound technical analysis principles uncompromised by fundamental considerations. They represent my own opinion and are not meant to be construed as trading or investment advice, but are offered as an analytical point of view which might be of interest to those who follow stock market cycles and technical analysis.
Andre Gratian Archive |
© 2005-2022 http://www.MarketOracle.co.uk - The Market Oracle is a FREE Daily Financial Markets Analysis & Forecasting online publication.