


Stock Markets Fall to Critical Support - The Moment of Truth?
Stock-Markets / US Stock Markets Jan 17, 2008 - 07:46 PM GMTBy: Marty_Chenard

 Are we approaching a "moment of truth"? ... where the market finds a bottom, or loses critical support that has a more serious down move?
Let's explore 3 charts where we can get an understanding of the juncture we have now come to.
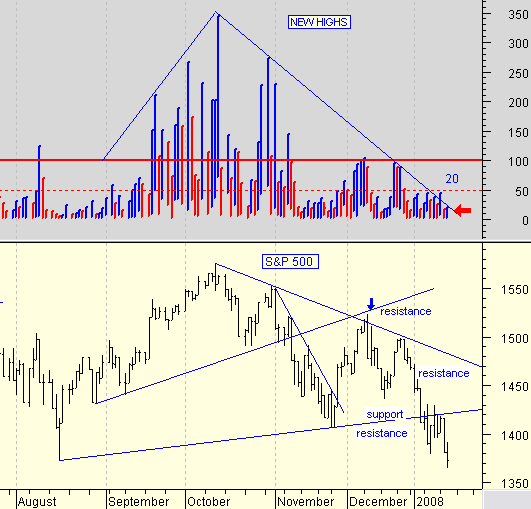
First, we will take a look at the New York Stock Exchange daily "New Highs". Strong rallies have New High levels above 100 ... preferably 150. This chart shows the correlation between the market's up movement and current down movement. Note how the New Highs have been below 100 since November and how the S&P 500 has continued down ... making lower tops and lower bottoms.
What is interesting about this chart, is the resistance line that has been in place since October. Note how the New Highs can't go much lower without breaking to the upside of the resistance line.
If a breakout occurs with levels above 100, then that will be bullish.
If however, it breaks out and remains below the 100 level, then that would remain bearish over the longer term even though we could see a short term upside move.
If it moves above the resistance line and remains below 50, then we could see a prolonged down move. See the next chart please ...
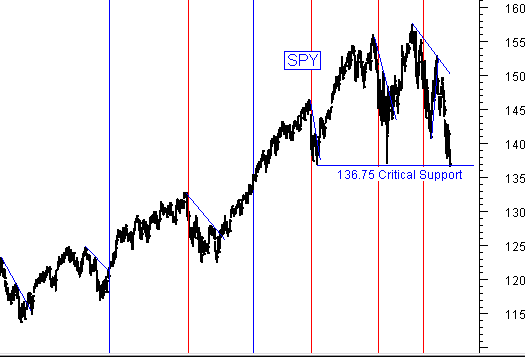
This is a long term view of the SPY. Note that there is a critical support line at 136.75. We are there now ... and we will test this support level in the next few days. Falling below it would have very negative long term implications.
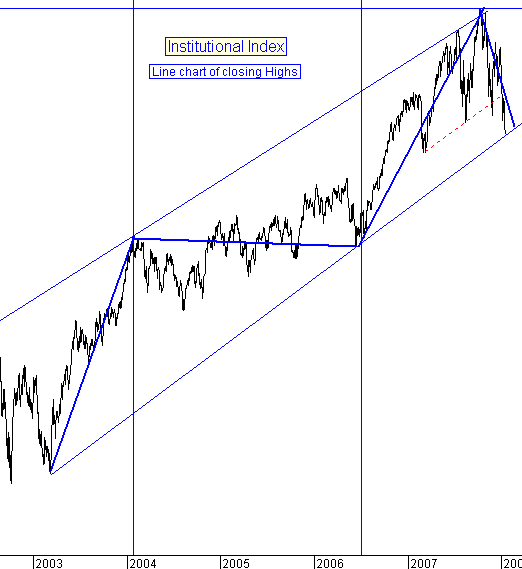
Coinciding with the SPY, the Institutional index of "core holdings" is also at a long term critical support level. Note the the Institutional Index is now at the support line on this 5 year upward channel. The stocks represented on this chart/index are the top stocks owned by Institutions which reflect's a major portion of their investment money.
We are now at a very important market juncture where a market direction has to be decided within the next few days.
(Note to paid subscribers: Yesterday, we posted a Special Report that answers the following questions:
What's going on in the market?
What significant change has occurred since December which is abnormal?
Why is the VIX holding steady while the market drops?
If you are a paid subscriber and have not read the Report, please login and follow the link on the Summary page.)
By Marty Chenard
http://www.stocktiming.com/
Please Note: We do not issue Buy or Sell timing recommendations on these Free daily update pages . I hope you understand, that in fairness, our Buy/Sell recommendations and advanced market Models are only available to our paid subscribers on a password required basis. Membership information
Marty Chenard is the Author and Teacher of two Seminar Courses on "Advanced Technical Analysis Investing", Mr. Chenard has been investing for over 30 years. In 2001 when the NASDAQ dropped 24.5%, his personal investment performance for the year was a gain of 57.428%. He is an Advanced Stock Market Technical Analyst that has developed his own proprietary analytical tools. As a result, he was out of the market two weeks before the 1987 Crash in the most recent Bear Market he faxed his Members in March 2000 telling them all to SELL. He is an advanced technical analyst and not an investment advisor, nor a securities broker.
Marty Chenard Archive |
© 2005-2022 http://www.MarketOracle.co.uk - The Market Oracle is a FREE Daily Financial Markets Analysis & Forecasting online publication.