US Stock Markets Dome Top Signals Tragic End of the Bull Market
Stock-Markets / US Stock Markets Jan 18, 2008 - 01:03 AM GMTBy: Clive_Maund

 The large top area now forming in the main US stock market indices is now approaching completion. Given the horrifying fundamentals it is a wonder that they haven't broken down and gone into freefall already. Only 2 things have supported the market since the major financial crisis burst out into the open last August. One is massive injections of liquidity - money that was created artificially out of nowhere by the Fed and central banks worldwide in order to paper over the cracks and buy time, which must feed through into higher inflation.
The other thing is Wall Street's primal need to pay itself huge Christmas bonuses, which might have become untenable had the markets nosedived. Now, with the big fat bonus checks comfortably cleared into accounts, one of the props holding the market up has fallen out. That only leaves more and more money creation and the investment community's awareness of this is driving gold higher and higher.

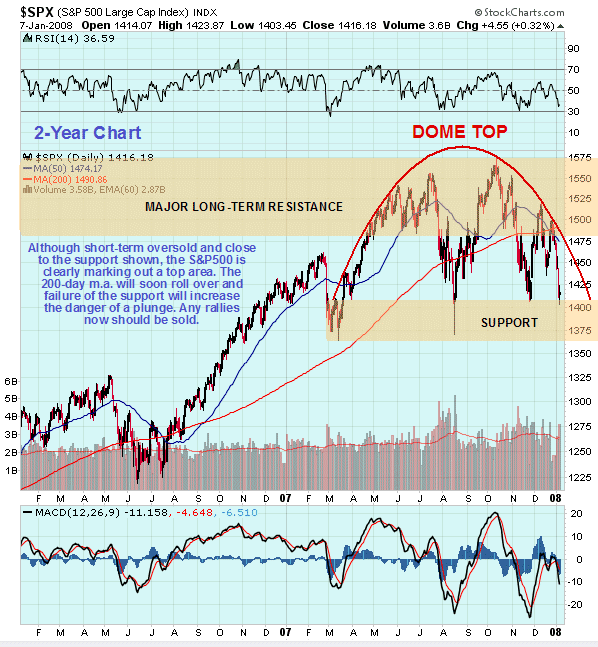
On the 2-year chart for the S&P500 index we can see how, following the August mini-panic, the market has zig-zagged around completing a large top area. Of particular note is the fact that the latest rally, the 'Santa Claus' rally in December, got nowhere near the earlier high in October before it petered out and went into reverse. This year then got off to a bad start with a steep drop, that has brought the index down to the top of an important zone of support. The 50-day moving average has dropped below the 200-day, which will soon turn lower, a bearish development. The index is now short-term oversold, however, so we may see some sort of rally, which is unlikely to get very far. Any near-term rallies should, of course, be sold.

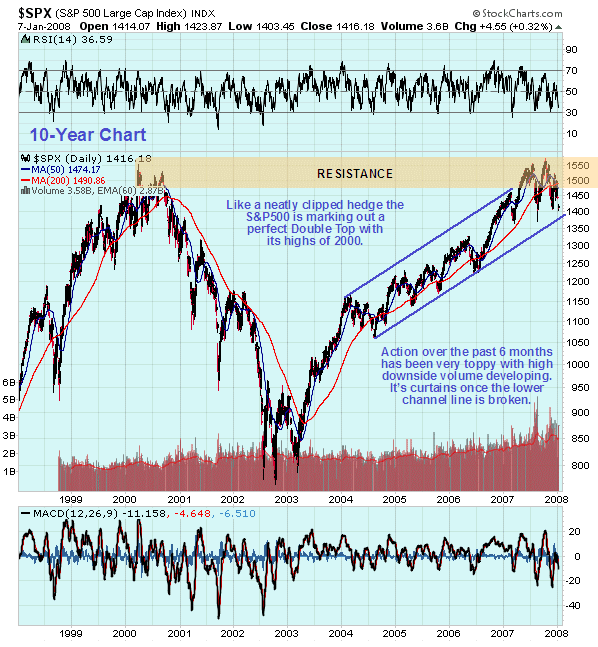
Any readers interested in topiary, the art of cutting hedges into shapes and figures, will appreciate the fine symmetry displayed on the long-term 10-year S&P500 index chart, on which we can see that the long uptrend in force from early 2003 through mid-2007 was brought to a dead stop by the heavy resistance at the 2000 highs, beneath which another top can be seen to be forming. On this chart it is clear that once the lower uptrend channel line fails, and the support in the 1360 - 1400 area is breached, the risk of a devastating plunge will increase substantially. Would such a plunge take down Precious Metals stocks with it? - no, because the circumstances causing it will result in gold and silver going parabolic - we have already seen gold and PM stocks decouple from the broad stockmarket during the past week or two, and they should now stay decoupled. Note that there is one exceptional circumstance in which the US stockmarkets could rally nominally, but still be falling heavily in real terms, and that is where the money supply is expanding at a very rapid rate, and inflation is rampant, so the rising prices mean nothing except that you can't make money out of Put options.
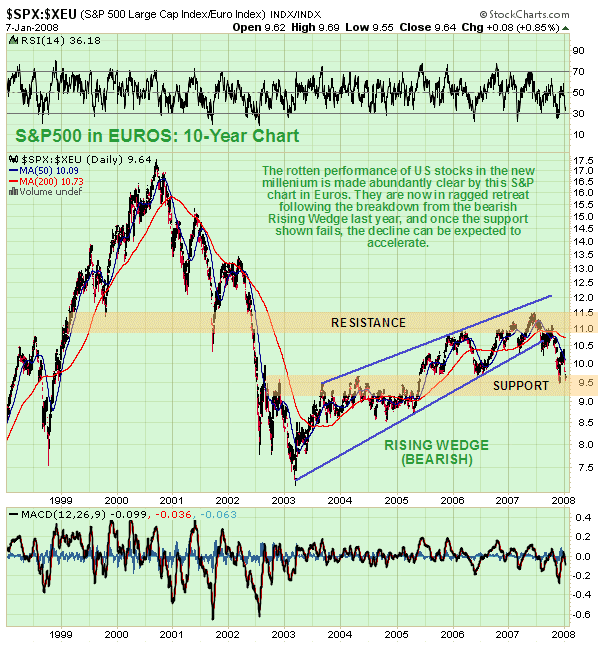
If you are impressed by the performance of US stocks generally since 2003, then you are probably suffering from delusion, a condition which fortunately can be cured almost instantly by glancing at the 10-year chart for the $&P500 index measured in Euros. This immediately reveals the advance from March of 2003 to be nothing more than an anemic bear market rally. This rally took the form of a bearish Rising Wedge which topped out last year where you would expect it to, beneath the neckline resistance of the large loose Head-and-Shoulders top that developed between 1999 and early 2002. Having broken down from the Wedge, the index (in Euros) has fallen back quite sharply to the support level shown. Once this fails the decline is expected to accelerate.

The conclusion from all of this should be obvious - apart from some isolated pockets of strength you should be out of the broad stockmarket by now, and any remaining holdings should be sold, especially on any short-term rallies, which can also be shorted. A high weighting of funds should be deployed in commodities generally and especially in the Precious Metals sector. Things are likely to get really rough for the US economy in 2008, which promises to be the worst year for the US since The Great Depression.
By Clive Maund
CliveMaund.com
© 2007 Clive Maund - The above represents the opinion and analysis of Mr. Maund, based on data available to him, at the time of writing. Mr. Maunds opinions are his own, and are not a recommendation or an offer to buy or sell securities. No responsibility can be accepted for losses that may result as a consequence of trading on the basis of this analysis.
Mr. Maund is an independent analyst who receives no compensation of any kind from any groups, individuals or corporations mentioned in his reports. As trading and investing in any financial markets may involve serious risk of loss, Mr. Maund recommends that you consult with a qualified investment advisor, one licensed by appropriate regulatory agencies in your legal jurisdiction and do your own due diligence and research when making any kind of a transaction with financial ramifications.
Clive Maund Archive |
© 2005-2022 http://www.MarketOracle.co.uk - The Market Oracle is a FREE Daily Financial Markets Analysis & Forecasting online publication.


