Get Ready for 'Hot' Inflation
Economics / Inflation Apr 20, 2012 - 01:42 AM GMTBy: Submissions
 Gregor Macdonald writes: Ideological deflationists and inflationists alike find themselves both facing the same problem. The former still carry the torch for a vicious deflationary juggernaut sure to overpower the actions of the mightiest central banks on the planet. The latter keep expecting not merely a strong inflation but a breakout of hyperinflation.
Neither has occurred, and the question is, why not?
The answer is a 'cold' inflation, marked by a steady loss of purchasing power that has progressed through Western economies, not merely over the past few years but over the past decade. Moreover, perhaps it’s also the case that complacency in the face of empirical data (heavily-manipulated, many would argue), support has grown up around ongoing “benign” inflation.
If so, Western economies face an unpriced risk now, not from spiraling deflation, nor hyperinflation, but rather from the breakout of a (merely) strong inflation.
Surely, this is an outcome that sovereign bond markets and stock markets are completely unprepared for. Indeed, by continually framing the inflation vs. deflation debate in extreme terms, market participants have created a blind spot: the risk of a conventional, but 'hot,' inflation.
The Fears of 2008
In the spring of 2008, on the back of the Fed’s easing program that began the previous summer, many global commodities were running to all-time highs. Agricultural commodities were in the headlines, and the high price of corn had caused riots in Mexico the year before. In many respects, the 2007-2008 period prefigured some of the food price pressures that would help drive the Arab Spring three years later, in 2011. Of course, the bulk of the headlines went to the master commodity, oil, which flirted with $90 twice before breaking above the $100 barrier.
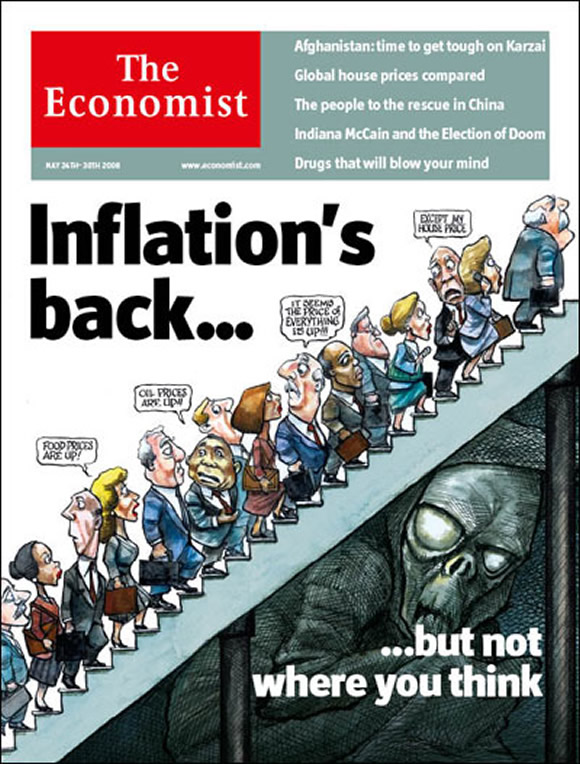
Market sentiment understandably turned to inflation. Indeed, during a few Fed meetings, Jeffrey Lacker of the Richmond Fed actually called for rate hikes. And the yield on the 10-year Treasury, which declined into a low of 3.88% towards the end of March 2008, actually rose again to 4.32% over three months into the end of Q2, 2008. The Economist magazine, always ready to provide the cover story, produced a rather memorable offering to the inflation angst that spring.
From its May 2008 story, Inflation’s Back:
“Ronald Reagan once described inflation as being “as violent as a mugger, as frightening as an armed robber and as deadly as a hit-man.” Until recently, central bankers thought that this thug had been locked up for life. Thanks to sound monetary policies, inflation worldwide had stayed low in recent years. But the mugger is back on the prowl.”
Here is the cover graphic:

Of course, we know how this particular story ended in 2008: badly. But not in the cloud of inflationary dust that the Economist magazine and hawkish members of the Fed envisioned. No, it ended “badly” with the most severe unleashing of asset deflation the United States had seen since the Great Depression, along with trillions of fresh credit dollars provided by the Federal Reserve needed just to stabilize the system during the long aftershock.
And the Deflationists Still Hold Some Cards
Four years later, the deflationists are still holding a few cards. True, actual recorded deflation was very brief and lasted only 6-9 months immediately after the crisis. And the deflationary spiral many predicted never did occur. Meanwhile, since 2008/2009, poor wage growth in the OECD and the continued supply of cheap labor from the developing world have ensured that one of the classic starter formulas for 'traditional' inflation -- tight labor markets and rising wages -- has failed to ignite.
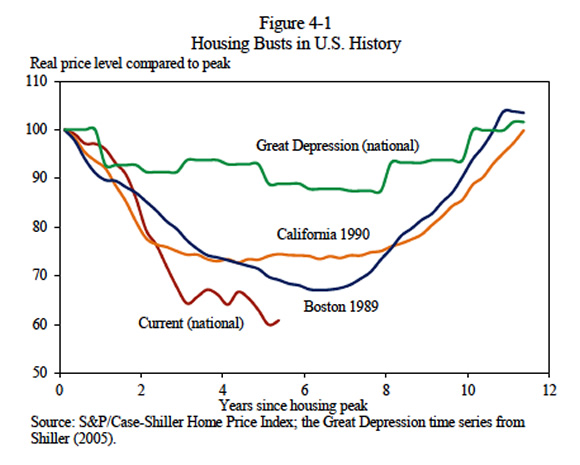
Probably no market better expresses the ongoing, structural headwind to developed market inflation than the busted housing market. US households have indeed been working off their debt levels the past few years, but have only reduced those levels by a little more than 3%, from the 2007 highs. With so many Americans still unemployed or underemployed, and with debt levels that constrain purchasing power and also constrain mobility (i.e., the ability to move across country for a new job), it’s no surprise the US housing market remains trapped at levels far below its highs.

Of course, we know how this part goes.
The above chart comes from the February 2012 Economic Report of the President. The above chart (from Chapter 4 of the report) shows that the current bust, in real terms, has seen the worst price decline of all, compared to other historic declines over the past century. Indeed, that there is now little prospect that US residential real estate will ever recapture the old highs says a lot about structural shifts in everything from energy prices to our workforce, that the US faces at least until the end of the decade.
Stealthier Versions of Inflation
But wait a moment. Even if US residential real estate is fated never to be a recipient of inflation, owing to its dependence on oil prices and the automobile-highway complex, is it not the case that Americans have had to endure already a great loss of purchasing power for some time already? The US story of poor wage growth is now marked by some as far back as the 1970s. That is the longer timeline that is often used to explain the transformation from single-earning to double-wage-earning households. Moreover, health care, food, energy, and education costs have seen outsized gains the past 10-15 years.
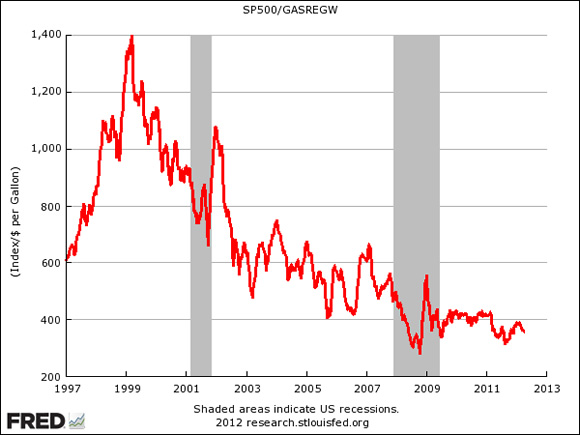
Considering that most US pension funds, whether by plan or through individual retirement accounts, rely on the stock market, it seems fitting to mark the performance of the SP500 against a basket of commodities. After all, every retiree (and many an institution) eventually converts their financial capital into resources for living. One chart that I like shows the 15-year performance of the SP500 against the most preferred liquid energy in America: gasoline. (chart courtesy of FRED)

While tediously repetitive, the term Middle Class Squeeze still carries weight, as all of the previous components of the problem have only been exacerbated more recently by high energy prices. The purchasing power of the SP500 has literally crashed against oil. What’s particularly handy about the above chart is that when the SP500 was roughly at 1400 near the turn of the millennium, gasoline was indeed (briefly) around $1.00 per gallon. Now, over 12 years later, the SP500 once again trades near 1400, only this time, gasoline sells for 4 times as much, around $4.00 per gallon. But is this inflation?
The loss of purchasing power is certainly a form of inflation. However, what we’ve seen in the past decade is that many of the price changes affecting Western economies have not been driven by tight labor markets, wage inflation, or even reflationary policy -- which the US has engaged for much of the past ten years. Instead, price level changes have emanated most strongly from the universe of natural resources, including everything from copper to oil, and, of course, agriculture. There is no question that cheap money policies from both the US and Japan have been driving speculative bubbles for some time. But housing and stock market inflation, as we have seen, have been transitory.
Structural Changes in Global Price Levels
Inflation has been running fairly hot in developing markets for some time. In regions like Asia, pressured to source food as growing populations bump up against limits to available arable land, the amount of capital devoted to food, shelter, and transportation remains high. However, if we think of lower-earning populations across the globe as a single class, there has been no protection from higher prices offered by developed economies to their poorer populations. The bottom two quintiles of US wage earners struggle with food and energy costs just as much as their counterparts across the globe.
These structural changes in price levels, along with the increasing inability of every population to endure them, have fallen into a statistical gray area. Headline measures of inflation in OECD countries churn out benign readings, while at the same time, poverty grows. But this is a particular kind of poverty, a food and energy poverty, which saps the power of consumers to spend disposable income on an array of other items.
This emerging resource poverty is going to drive further changes in price levels, and in particular it will restrain many forms of consumption, including real estate prices. Cities will find, for example, that with the price level of food rising and real estate prices stagnant with rising transportation costs, urban farming is going to advance very strongly. Note, for example, the resurgence in urban farming in places like Brooklyn, NY, where large tracts of industrial land have lain fallow for decades. Indeed, a classic pattern of 'hot' inflation is that it quickly begins to drive out spending for discretionary goods in favor of true basics, like food.
The Risk We Face
The United States currently enjoys reserve currency status, which enables it to borrow cheaply, and which keeps capital circulating through our government bond markets, which are the largest in the world. Given the backdrop to our post-credit-bubble environment, it is now the consensus view that we will cut a path similar to Japan’s as we oscillate from weak growth back to the stimulative rescue policies of the Federal Reserve.
There is therefore a sense of complacency about an escalation in prices.
In Part II: The Triggers That Will Spark 'Hot' Inflation, we explain how many of the factors which have restrained prices globally at colder levels will start to run hotter soon.
First, there are structural changes taking place in the developing world with regards to urbanization and the trajectory of labor markets. Can the supply of cheap labor in the non-OECD continue indefinitely?
Second, populations in the OECD are increasingly trapped in “safe” investments, such as government bonds, which currently restrain interest rates from moving higher. But this also creates a latent vulnerability for if perceptions of safety and loss of purchasing power were to shift hard. This shift in perceptions is ultimately more critical in any step-change to higher inflation than the supposed quantity of “money-printing” that’s been undertaken by global central banks.
Finally, we look at the assets that will benefit, as well as those that will suffer most, should a stronger inflation develop.
Gregor Macdonald
© 2012 Copyright Dr Martenson - All Rights Reserved
Disclaimer: The above is a matter of opinion provided for general information purposes only and is not intended as investment advice. Information and analysis above are derived from sources and utilising methods believed to be reliable, but we cannot accept responsibility for any losses you may incur as a result of this analysis. Individuals should consult with their personal financial advisors.
© 2005-2022 http://www.MarketOracle.co.uk - The Market Oracle is a FREE Daily Financial Markets Analysis & Forecasting online publication.


