The Fed and their Influence on Gold and the US Dollar, Behind The Curve!
Currencies / US Dollar Apr 26, 2012 - 12:21 PM GMTBy: UnpuncturedCycle
 I am not surprised to see that the Federal Reserve on Wednesday stood pat on interest rates and said economic growth will remain moderate over coming quarters and then only pick up gradually. The decision to make no changes was expected. Economists think the Fed will wait for more data before deciding how to proceed next. Recent data, such as the monthly jobs report from the Labor Department, point to a slowing pace of economic growth. In a statement, the Fed announced that it will leave its target range for its federal-funds rate unchanged at 0 to 0.25% — as it has for every meeting since December 2008. The central bank also did not change the forecast that “exceptionally low rates” will be here until late 2014. Richmond Fed President Jeffrey Lacker cast the lone dissent, continuing a trend at all three meetings this year. Lacker, one of the more hawkish regional Fed presidents, has argued against the 2014 rate forecast.
In its statement, the Fed said that it “expects economic growth to remain moderate over coming quarters and then to pick up gradually.” Fed officials said they expect the increase in oil and gasoline prices “earlier this year” is expected to affect inflation only temporarily. The Fed made some subtle changes to its view on the economic outlook. The Fed statement said that labor market conditions “have improved in recent months.” In March, the central bank said only that the job market conditions “have improved further.” The Fed repeated that the jobless rate remains elevated. The Fed also repeated that the housing sector remains depressed, but added that there were “some signs of improvement.”
At the meeting, the Fed made no changes to its Operation Twist plan designed to put pressure on long-term rates by selling $400 billion of short-term debt and buying longer-term securities to lengthen the average maturity of securities on its balance sheet. This program is set to expire at the end of June. The Fed will also continue to reinvest principal payments from agency debt and mortgage-backed securities back into the MBS market. The Fed will also keep rolling over maturing Treasury securities at auction. As a result of the minutes of the last Fed meeting on March 13, Fed experts have scaled back their expectations of another round or asset purchases, or quantitative easing. In the summary of the March 13 meeting, Fed officials indicated that they would be willing to buy more assets only if the economic outlook weakens.
Meanwhile back in the good old US of A we saw the number of Americans who filed requests for jobless benefits was virtually unchanged last week at 388,000, the U.S. Labor Department said Thursday, keeping claims near their highest level of 2012. Claims from two weeks ago were revised up to 389,000 from 386,000. Economists surveyed by MarketWatch had projected claims would drop to a seasonally adjusted 375,000 in the week ended April 21. Meanwhile the average of new claims over the past four weeks climbed by 6,250 to 381,750, matching the highest level of the year. Continuing claims increased by 3,000 to a seasonally adjusted 3.32 million in the week ended April 14, the Labor Department said. Continuing claims are reported with a one-week lag. About 6.68 million people received some kind of state or federal benefit in the week ended April 7, down 87,160 from the prior week.
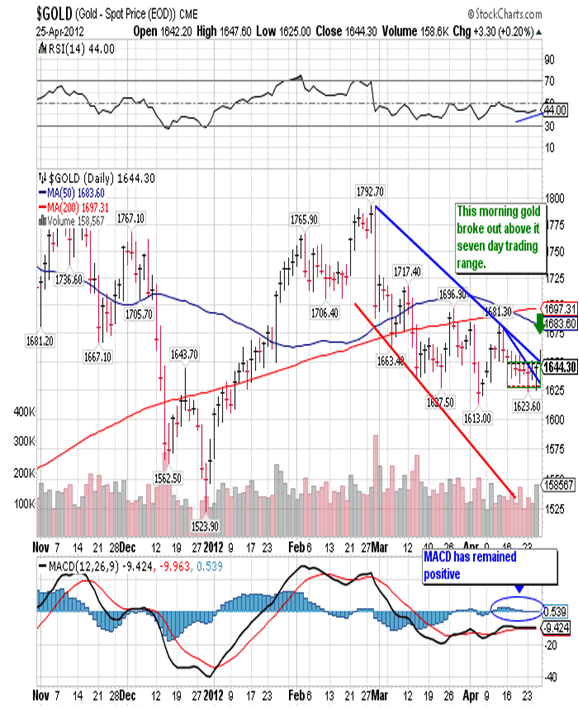
Of course yesterday was all about the Fed, at least if you believe everything you hear on TV. Many had high hopes for some indication as to when we might see QE3. As soon as the Fed decision was announced the spot gold price fell down to 1,625.00, just above strong support at 1,622.00 and still above Monday’s intraday low of 1,623.60 as you can see below:

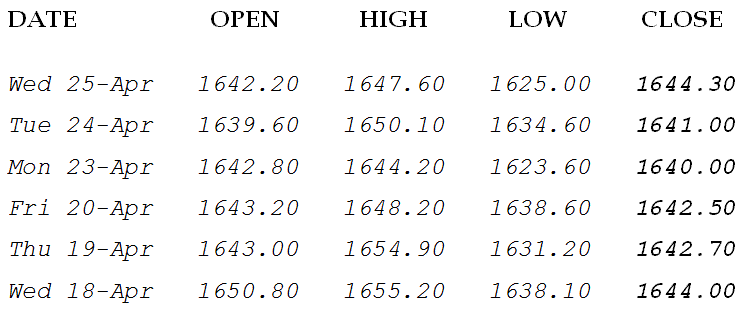
For the last six sessions we’ve seen gold trade in a range (green box) that runs from 1,623.60 to 1,655.00 and the daily closes have gone nowhere as you can see here:

Gold went nowhere over the last week as bears sold 1,650.00 in an effort to push gold down below strong support at 1,622.00, and bulls bought below 1,630.00 because it looked cheap to them.
Yesterday’s Fed decision was the last chance to break gold down but once the initial knee-jerk reaction took place it began to recover and eventually closed up 3.30 at 1,644.30. This morning gold is up another 10.00 at 1,654.30, a breakout to the upside, and has traded as high as 1,656.30 as the weak shorts were forced to cover. More than likely the next line of defense will be at 1,671.00 and good support will be down at 1,640.00 as gold works its way higher in spite of the price suppression.
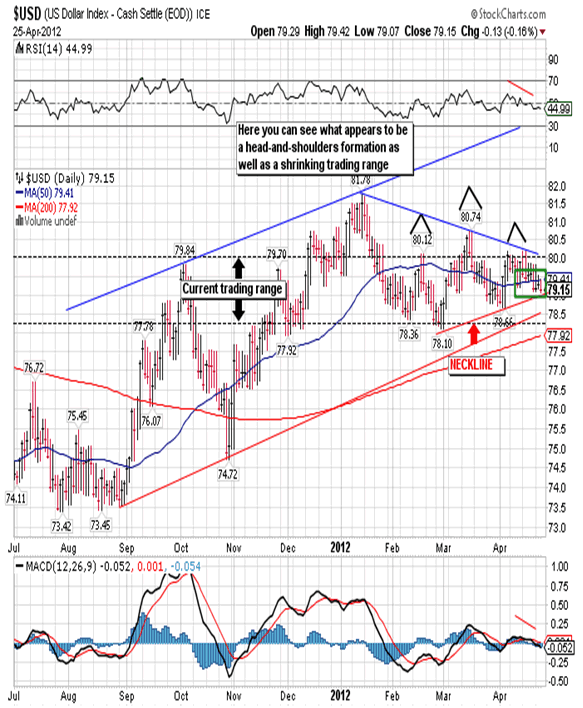
Anti-gold, better known as the US dollar, is of course behaving inversely to the yellow metal. It too has been trading sideways in a tight range (green box) but still managed to complete the right shoulder in a head-and-shoulders formation as seen below:

Yesterday it closed at 79.15, just above the neckline, and this morning traded well below the neckline, as low as 78.84. Once the US dollar can close below the neckline it will begin its descent down to a test of critical support at 78.25. Such a test may not be all that far away.
Giuseppe L. Borrelli
www.unpuncturedcycle.com
theunpuncturedcycle@gmail.com
Copyright © 2012 Giuseppe L. Borrelli
- All Rights Reserved Disclaimer: The above is a matter of opinion provided for general information purposes only and is not intended as investment advice. Information and analysis above are derived from sources and utilising methods believed to be reliable, but we cannot accept responsibility for any losses you may incur as a result of this analysis. Individuals should consult with their personal financial advisors.
© 2005-2022 http://www.MarketOracle.co.uk - The Market Oracle is a FREE Daily Financial Markets Analysis & Forecasting online publication.


