Gold takes a Spring Break
Commodities / Gold and Silver 2012 Apr 27, 2012 - 02:11 PM GMTBy: William_Bancroft
 There has been a range of intelligent analytical opinions recently espoused, seeking to explain the action in the gold price this last six months. Whilst we have found articulations focused on consolidation most conducive, quality analysis has not just been found this side of the debate. Outside of lazy assertions that the gold bubble has burst, the debate has been heated but useful. It is always as such for gold. In the office we call the gold market the fox-hunting debate of the financial markets; very few participate but many have strong and at times heated opinions on the matter.
A quick and useful piece on recent price action in the precious metals was recently published by Jordan Roy Byrne at The Daily Gold. Mr Roy Byrne sees gold and silver as “correcting multi-year advances”, noting that these corrections are now evolving into more extended consolidations. A decline in volatility along with general interest and sentiment in the market are deemed important to put a ‘bottom’ in in the precious metal prices. During an extended consolidation we are advised that these bottoms take time to develop.
Consolidation in the gold price
Mr Roy Byrne starts by looking at the gold price, and he finds price and market behaviour befitting a consolidation:
Let’s start with gold. At the top we plot the average true range (ATR) indicator which is a helpful volatility indicator of sorts. When it becomes stretched or rises too high on the chart, we can expect a reversal in trend. Note that the ATR indicator often hits a low prior to or soon after the start of an impulsive advance. This occurred with every major move with the exception being 2008 when volatility peaked during the financial crisis which sent gold down 30%. Also, the yellow shows what was an uncorrected two year advance from $900 to $1900. This 25-month advance has been followed by an 8-month correction.
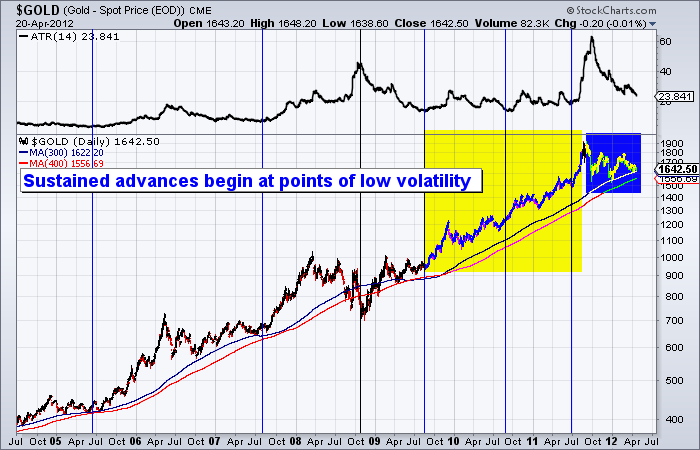
Using Fibonacci retracements and technical analysis Mr Roy Byrne sees the gold price continuing to correct for a few months more. So perhaps gold is set to slip quietly into its oft-cited summer lulls before we’ll see any decisive further price action?
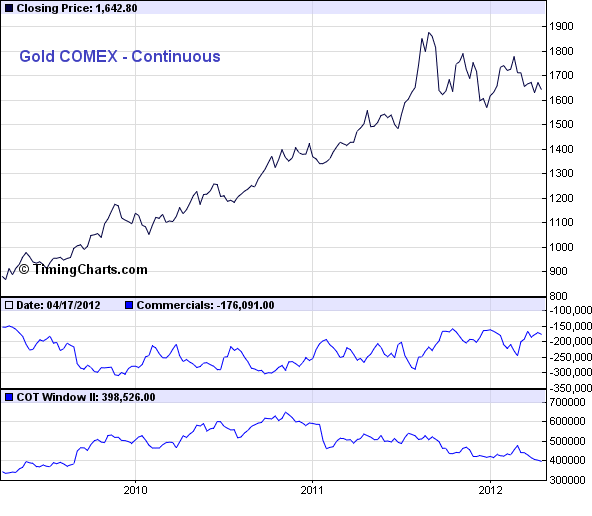
A look at the commitment of traders report (COT) for gold might also be instructive. Mr Roy Byrne cites commercial short positions at near three year lows, implying very limited speculation in the market. Added to this “open interest has declined since late 2010 and sits at a multi-year low”. Levels of participation, let alone speculation, are at notably low levels. Such thin markets are potentially more illiquid and may be poised for price discovery in a new direction.
The correction in gold has become a consolidation. Whilst a picture of a ‘bottom’ in the gold price is building, the abovementioned conditions may not automatically manifest into a rising gold price immediately. Gold investors may have to wait a few months longer.
Silver echoing gold, but with more volatility
Action in the silver price, although exhibited over a longer period, exhibits some apparent similarities to action in the gold price this last 8 months. Silver did have a more impressive run to digest. Mr Roy Byrne reminds us that:
Periods of low volatility have coincided with the start of major moves in silver. The examples are 2005, 2007, 2009 and 2010. Silver advanced from $8 to $49 in about 29 months. The market has been in a correction for 12 months. Applying Fibonacci analysis, we’d expect the correction to last 11 months, 14.5 months or 18 months. Thus, silver could continue to consolidate for several months.
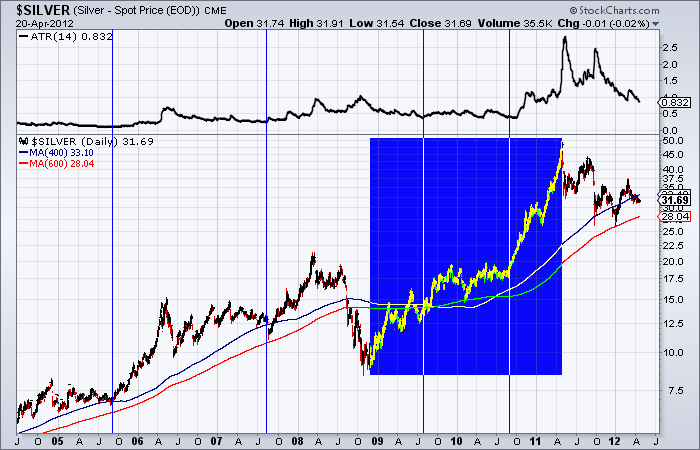
When looking at the COT for silver Jordan Roy Byrne notes “commercial short positions are at 26.5K contracts which is relatively close to the 10-year low seen at the end of 2011” and that “open interest has begun to climb higher but it remains well below the peaks seen from 2009-2011”.
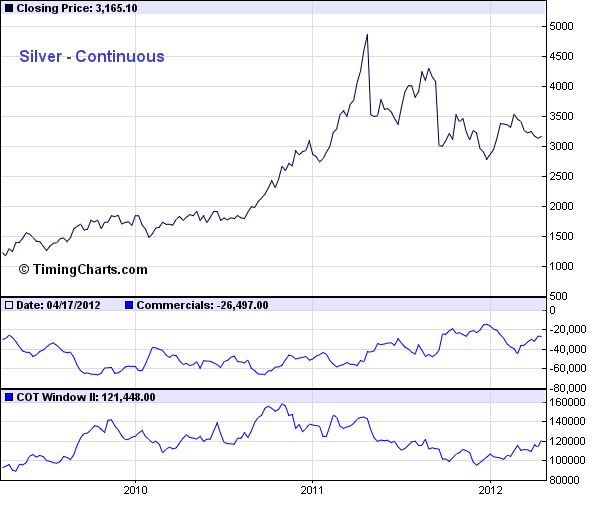
As for gold, the discussion for silver above does not necessarily mean imminent price moves higher for the restless metal. But, silver does appear to also be doing some consolidating after its headline grabbing run up over 29 months post the Credit Crunch. As Mr Roy Byrne advises:
Markets cycle between periods of advance, correction and consolidation as well as periods of high volatility and low volatility. In the case of Commodities, these states tend to be magnified. Advances can be sharp and fast and the same goes for corrections. Because of this, multi-month consolidations are often required to digest these big moves. When the market finds an equilibrium, which occurs at low volatility, the primary trend can reassert itself.
The point is, gold and silver made major moves in recent years lasting 25 months and 29 months. Such moves are not corrected and digested in a period of only a few months. As we should know by now, it takes many months. As the market gets deeper into these corrections and they become consolidations, volatility falls, bullish sentiment recedes and general interest abates. These are the conditions that precede important lows… This is how markets work.
Extended holidays for gold and silver
In his concluding comments Jordan Roy Byrne contextualises his thoughts of further to go in these gold and silver price consolidations with reference to the ‘summer lulls’ in the precious metals and how the consolidation might end as the precious metals awake from their summer slumber.
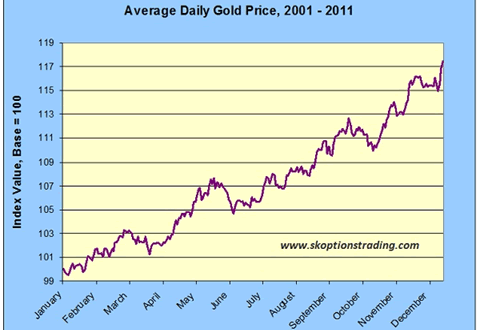
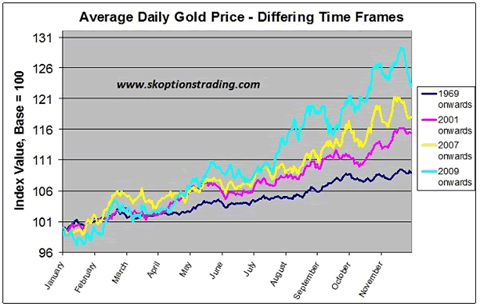
The middle of the year and summer period has often been cited as a period of price weakness for gold and silver, and a range of other asset classes in fact. The saying ‘sell in May and go away’ is familiar to many. A February piece from Bob Kirtley of Skoptionstrading.com took a detailed look at this and whether seasonality in the gold price really does mean anything for gold investors. Within his analysis Bob Kirtley writes that:
“Between late April and early July, gold has been very flat over the last 11 years, as shown by the graph with an average rise of only 1.4 index points – or just under 1.3% for the period, which corresponds to an annualized return of 6.1%, paling in comparison to the average return annually between 2001 – 2011 of around 19%.
These slow months are known as the summer doldrums. People love to speculate what the reason behind the summer slowdown is. Who knows what the actual reason is, but it could simply correspond with traders/investors taking vacation and demand slowing for that reason. You would imagine that demand for gold will correlate somewhat with global economic activity and with that activity slowing in summer, so too does the demand for gold. A key part may also be simply the perception of the summer doldrums, investors expect things to be quiet around this time of year and therefore refrain from taking large positions, which results in the market being more subdued in a self-fulfilling prophecy.”
Mr Kirtley also finds similar seasonal gold price action also exhibiting itself over a range of time periods noting that “the peaks and troughs closely correspond in each time frame”. Gold’s seasonal nature has been exhibited since 1969, and if anything appears more pronounced over the shorter time frame.
Modelling the gold price
Mr Kirtley uses his data to model what previous seasonality suggests gold prices could be at different times later this year (2012). With reference to a February 8th gold price of $1,746/ounce the model throws out some interesting results.
| Date | Model Used | 2001 | 2007 | 2009 |
| March 8 2012 | $1,774 | $1,814 | $1,820 | |
| May 8 2012 | $1,820 | $1,835 | $1,881 | |
| July 8 2012 | $1,820 | $1,839 | $1,898 | |
| September 8 2012 | $1,908 | $1,941 | $2,111 | |
| November 8 2012 | $1,954 | $2,053 | $2,217 | |
Whilst these results are interesting and not impossible to imagine, also including a few instances of a psychologically important >$2,000/ounce gold price, their predictive power is based on the inputs to the model. As Mr Kirtley then considers there could be a fly in this ointment. Whilst over a range of years gold has demonstrated some apparent seasonality, over the shorter term it can be erratic and less consistently seasonal. See below for a more granular look at gold price seasonality.
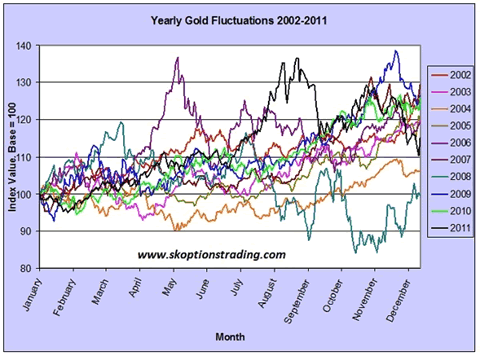
Patterns and seasonal behaviour in the graph above are indeed harder to identify. Mr Kirtley suggest this is a “good reminder that anything can and will happen in any given year”. Events like those of Q3 2008 can make a mockery of longer term historical seasonality, and there are currently a range of extraneous threats to the financial system. As one of our favourite commentators, Doug Casey, mused a few weeks back: “black swans the size of pteranodons are circling in squadron strength”.
Price predictions for gold and silver
Whilst making explicit price predictions for any financial asset is often a mug’s game, Mr Roy Byrne’s specific explanation of consolidation feels pretty much on the money to us. Beyond this we know that gold’s seasonality could be knocked out of consideration for this year by QE3 and other central bank actions (Japan anyone?), a hard landing for China, further events in the Eurozone, or a plethora of less immediately obvious phenomena. It feels like the risk of gold’s seasonality being negated this year could be higher than usual.
However, if the black swan squadron passes over this year, precious metal investors might salivate at the thought of these consolidations ending into a period when gold has shown seasonal strength in Q3 and Q4. For now gold is still waiting for a catalyst. We also agree with Dr Steven Leeb when he offered earlier in the year that silver may be waiting for its bigger sister to explore higher price levels before showing any convincing new price action itself.
Worried about debt mountains, money printing and crashes? Invest in gold, and act as your own central bank…
Will Bancroft
For The Real Asset Company.
Aside from being Co-Founder and COO, Will regularly contributes to The Real Asset Company’s Research Desk. His passion for politics, philosophy and economics led him to develop a keen interest in Austrian economics, gold and silver. Will holds a BSc Econ Politics from Cardiff University.
© 2012 Copyright Will Bancroft - All Rights Reserved
Disclaimer: The above is a matter of opinion provided for general information purposes only and is not intended as investment advice. Information and analysis above are derived from sources and utilising methods believed to be reliable, but we cannot accept responsibility for any losses you may incur as a result of this analysis. Individuals should consult with their personal financial advisors.
© 2005-2022 http://www.MarketOracle.co.uk - The Market Oracle is a FREE Daily Financial Markets Analysis & Forecasting online publication.
Comments
|
Rod
28 Apr 12, 20:06 |
Gold
Hold through summer. If you sell it is hard to find a reason to buy back in time to catch the upward move. Bitter experience. |


