Dow Theory - How the Transports Confirms the Dow Jones Breakouts
InvestorEducation / Cycles Analysis Feb 12, 2007 - 01:10 PM GMTBy: Tim_Wood
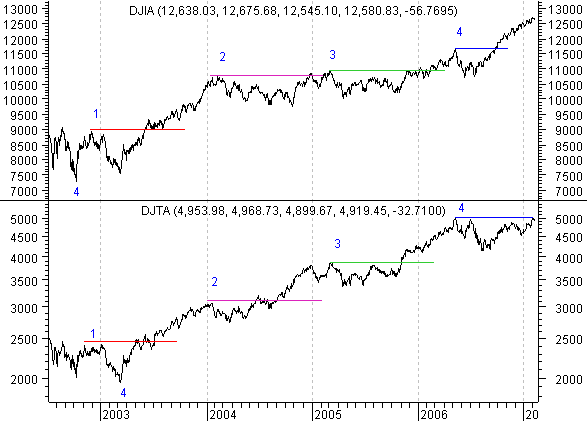
 In light of the recent rally in the Transports I thought that it would be appropriate to discuss the Dow theory and this recent move by the Transports. According to Dow theory the confirmation of a trend occurs when both averages better their previous Secondary high or low point, depending on whether or not the trend is up or down. Without going into exactly how you define a Secondary high or low point let me just say that the May 2006 highs marked the last Secondary high in both averages.
This level is noted by a blue horizontal line on the Dow theory chart below and is also labeled with a 4. Before that, the previous Secondary high points occurred at the March 2005 high. That level is noted in green and is labeled with a 3. As of May 2006, with both averages well above their previous Secondary high points, again that being the March 2005 highs, both the Transports and the Industrials were “in gear” and made joint highs in May 2006. The closing high at that time for the Industrials came on May 10, 2006 at 10,642.65 and on the Transports the high close occurred one day earlier on May 9, 2006 at 4,998.75.
So, as of May 2006 the averages were confirming each other and in that respect, all looked well. It was the Dow theory phasing and valuations that were not making sense at that time. Now, many of you may be thinking, wait a minute. Back in May 2006 the Transports were sitting at an all time new high, but the Industrials had not yet moved above their 2000 high. Therefore, how could the averages be “in gear” with each other? Today, I want to attempt to explain this. First, let's talk about the 2000 high, which was obviously an important high, but it had to do with the Dow theory phasing, not trend confirmation. These are two entirely different issues.
Let's begin this explanation with the Dow theory chart above and the Secondary high point labeled with a “1.” Once both averages moved above this level, as is indicated in red, the trend was confirmed as having been up. This is true because of the fact that the previous Secondary high point had been bettered. So, let me stress that at that moment, the averages were at that time in sync to the upside. But, also at that time we had a Dow theory phasing issue at play. This phasing issue was at that time telling us that the 2000 top marked the top of a giant secular bull market that had been in effect since 1974. The phasing aspects of Dow theory indicated that the advance up out of the 2002 low was a counter-trend move separating Phase I from Phase II of a newly born secular bear market. So, there were two very different issues at play here.
Anyway, the averages ultimately advance up into the next Secondary high point labeled “2.” At that high there was a minor non-confirmation in that the Transports topped in January 2004 with the Industrials topping in February. That minor non-confirmation lead to the decline into March 2004, which marked the next Secondary low point for the Transports. Then, by late June the Transports had once again moved above their previous Secondary high point , but the Industrials had not. This in turn created yet another non-confirmation at a Secondary level.
That non-confirmation seemed ominous to the averages, but then in December 2004 the Industrials finally reconfirmed the Transports and once again the averages were back “in gear.” A correction followed immediately after this confirmation as the averages moved into the January 2005 lows. From there, once again, the previous Secondary high point , number 2, was bettered as the market moved into a new Secondary high point in March 2005, which is labeled number “3.” At that point, again, the averages were back “in gear” to the upside. All the while, we had the longer-term phasing issue surrounding the 2000 top at play.
Nonetheless, the averages were once again “in gear” to the upside. From the March 2005 high the averages drifted sideways into October 2005. In November 2005 the Transports moved back above their March 2005 Secondary high point , but the Industrials did not. So, yet another non-confirmation was born. Then, in January 2006 the Industrials joined the party by moving above their March 2005 Secondary high point and once again both averages were back “in gear.” This then carried the market up into the May 2006 top at which point both averages made a joint high and once again were “in gear” with each other. All the while, the Dow theory phasing issue concerning the 2000 top was still lingering and still indicating that the rally out of the 2002 low was a giant counter-trend move separating Phase I from Phase II of an ongoing secular bear market. Anyway, from the May 2006 highs, the averages moved down into their Secondary lows back in the summer. It was from those lows that the latest non-confirmation began. As you can see, in late September the Industrials moved once again above their previous secondary high point and this time the Transports lagged creating yet another non-confirmation. Then, on February 2, 2007 the Transports closed at 5,006.89, which finally topped the May 9, 2006 Secondary high point close of 4,998.75. In doing so, this once again put both averages back “in gear” to the upside.
What has now changed is with the latest advance, both the Industrials and the Transports are now at all time new highs. With the Industrials moving above the 2000 high it now means that the phasing concerns, that had been at play since the 2002/2003 low, have been proven inapplicable. In turn, this proves that by far the most important aspect of Dow theory is in fact the Secondary price movement and as of this writing both averages are once again “in gear” to the upside. The much longer-term Dow theory phasing is valuable, but I feel that the evidence shows us that it can only be used reliably after the much longer-term picture is confirmed much further down the road, say after Phase II is confirmed rather than during what may appear to be a Phase I move. Understand that I am in no way minimizing the Dow theory. I'm merely saying that the price action since 2002 has definitely proven that the “Secondary movements” are by far the most important aspects.
So, the thing that most people are now wondering is, what does this latest confirmation mean? I hear some say that it means we are now in a new bull market. I also hear others say that the Transports have joined the party late. Truth is, the Dow theory does not tell us either. This latest confirmation by the Transports merely tells us that the Secondary Trend has been reconfirmed. It does not tell us how far the averages will go. This confirmation merely serves, just as the previous confirmations did, to reconfirm both the Secondary trend and now with both averages at all time new highs the latest confirmation also serves to confirm the Primary trend. I can also tell you that this confirmation does not signal a “new” bull market, but rather reconfirms the existing bull market.
 |
Cycles are not a part of Dow theory, but they are a separate tool that allows us to quantify trends of like degree and to develop longer-term expectations that are based upon statistical probabilities. It is the cycles work and the related statistics surrounding the 4-year cycle that causes me to believe that the Transports have joined the party late in the game. I realize that most of the rest of the world believes that the 4-year cycle bottomed at the June/July 2006 lows. But, my statistical and trend quantifications do not support this popular notion.
I have been saying for well over a year that the 4-year cycle low would occur in 2007 and not 2006. This was first documented in January 2006. Based on these same cyclical quantifications I was able to call the May high as well as the summer low and reported publicly in June that the summer rally had begun, but that the summer low was not the was not the 4-year cycle low. Today, nothing has changed this opinion. In fact, the statistics surrounding this setup actually called for yet additional new highs and that was reported to subscribers back in November and has unfolded pretty much to script.
But, I will also add that it was in September that I began to get very skeptical of the current advance and that skepticism has not changed. However, in spite of my skepticism, my original intermediate-term buy signal that occurred at the summer lows remained intact until early December. Honestly, I did not expect it to hold up that long, but it did and above all I follow the indicators. I'm now neutral and more skeptical than ever. I still look for the 4-year cycle low ahead and this opinion is based on statistical data that I have been watching unfold for just over a year now. All the while, we are seeing extreme complacency, continued record sentiment readings and a VIX that is at 13 year lows.
This reminds me of 2001 when with the Industrials well over 10,000 I was calling for a drop into the 2002 4-year cycle low with a minimum price target calling for a violation of the 1998 4-year cycle low at 7,400. That call was based on these very same statistics surrounding the 4-year cycle. I was told that I was nuts. I was told that the 4-year cycle had contracted and that it had bottomed in 2001. I was told that this time was different because of 911,etc, etc, etc. Obviously, as it turned out, the statistical data proved correct and here again I'm simply going with the hard cold data. I will not be swayed by popular opinion that is not based in fact, but rather largely in emotion. My approach is disciplined and it has specific rules and guidelines. I'm sticking to this data once again until/unless it is proven wrong. All the while, I think that every last possible participant is being sucked right into the market, as is typically done at 4-year cycle tops and as the public once again thinks “This time is Different.” Based on the statistics, there is a surprise in the making and very few believe it.
By Tim Wood
Tim Wood specialises in Dow Theory and Cycles Analysis - If you are interested in a statistical and technical based source that also utilizes Dow theory and provides statistical probabilities as to what should occur, then Cycles News & Views may be for you. I also provide web-based updates giving short and intermediate-term turn points on the stock market, gold, bonds and the dollar, utilizing my Trend and Cycle turn Indictors. A subscription also includes short-term updates three nights a week. Please see www.cyclesman.com/testimonials.htm .
© 2005-2022 http://www.MarketOracle.co.uk - The Market Oracle is a FREE Daily Financial Markets Analysis & Forecasting online publication.


