


Is the US Killing the Euro?
Currencies / Euro Apr 30, 2012 - 12:16 PM GMT

 In 2004 for the first time it was reported that criminals were shunning US-Dollars in favor of Euros. Near Acapulco (Mexico) on Wednesday, December 8th, 2004, two armed men hijacked a bus threatening to blow it up with explosives unless their demands were met, one of which being a ransom payment of two million Euros (LA Times, 11th December 2004, p7). Obviously, the actions of these hijackers are deplorable, but it demonstrated a turning point for the Euro and just how great the disdain for the United States Dollar has been. Even hijackers shun US Dollars. The reason for such behavior can be found in the chart below:
Figure 1: US Dollar versus Euro
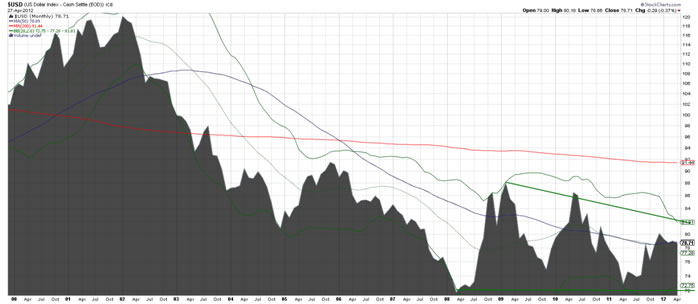
Chart source: stockcharts.com, chart produced by Hable
The above chart is very straight forward: since the birth of the Euro the USD has been declining against the Euro and other major international currencies with no technical and fundamental end in sight. The technical picture of the USD shows a large descending triangle which is an indication for further downside for the USD. This chart is in sharp contrast to the repeatedly announced “strong-dollar policy” by the US administration.
So what is going on here? Did the US government surrender to the power of the Euro, or is it part of a new tactics not yet quite understood by European policy makers? Fighting an opponent doesn't always mean opposing his force. When faced with overwhelming power, good fighters often use their attacker's force to their advantage (Sunzi, 1901), like in Judo, for example. In my view that appears to be the case with US tactics against the Euro.
Let me explain that view by having first a look at the current situation:
It is with utmost interest that I watch the usually very upbeat news on CNBC, one of the reasons being to be able to answer anxious questions from nervous investors, who call in the next morning in order to inquire about the latest CNBC broadcast. So at the same time I also have the pleasure to regularly watch two fast-talking and squeaky clowns in the CNBC circus (Vieira da Cunha, 2001) who, for the last few years, have given their upbeat views on any economic, financial, and political issues. The "know it all" duo's advice has not been particularly rewarding for investors, and had you invested your money according to their "never in doubt" bullish mantra, your assets would be worth today at least 78% less than in 2000 (in terms of Euro or in a hard currency such as gold, they would be down in value by another 25%), (Hable, 2004, and Lefevre, 1994). But since poor advice is not only endemic to those two relentlessly irritating financial commentators but is almost a prerequisite for success in the financial service industry, I shall not hold it against them. Still I have a question relating to a statement by Mr. Kudlow, which somewhat surprised me and others. In an article he explained why "the current economic situation is a lot like the start of the Reagan Boom 30 Years Ago". Hello?!
Now, I have some serious reservations about this comparison for the following reasons. If you look at interest rates over the last 40 years or so, you will see that when, in 1980, Mr. Reagan became President of the US, rates were near their highs and since Mr. Volcker (then the Fed chairman) pursued at the time very tight monetary policies he managed to bring down the rate of inflation, and subsequently also interest rates, which then fell for the next 22 years and also enabled him to keep money supply under tight control. Needless to say that whereas interest rates were sky high in 1980 and significantly above the rate of growth of nominal GDP, today the Fed Fund rate is significantly below the rate of nominal GDP, which suggests that short term interest rates can only rise if nominal GDP continues to expand. The figure below clearly shows that we are by far not in a Reagan type economy but rather in typical a third world country situation in which inflation is used to decrease debts and cover up severe budget problems. Just in the past 12 months the US money supply has been blown up by 10%. What does this mean for you dear reader? Stock markets will soar, gold will soar, and your modest savings will shrink at an alarming rate even if you spend nothing.
Figure 2: US Money Supply Growth
Now, I have no doubt that money has become tighter even has the money supply has been increasing begging the question where the banks hoard all that cash. It is without a doubt that obtaining credits for businesses in general has become a lot harder since 2008. However, we should not overlook the fact that despite tighter credit lines and money supply - the Fed fund rate has been decreased to historic lows – and thus compared to nominal GDP growth and inflation, short term interest rates are way too low. In fact, at the Fed fund rate is far below the unofficial US inflation rate of about 6 to 7% and significantly below nominal GDP growth.
Figure 3: Nominal GDP Growth and 10-year Government Bond Yield before and during Mr. Volcker’s reign (Source: The Bank Credit Analyst)
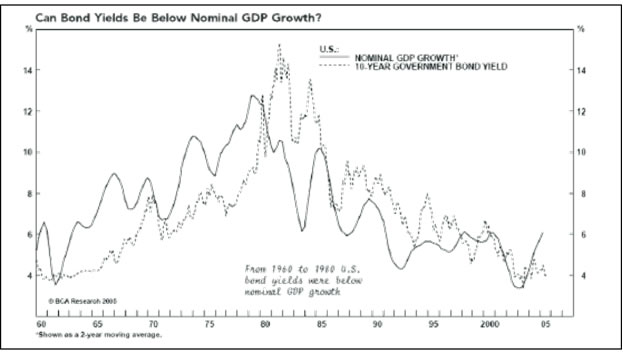
The tight monetary policies of Mr. Volcker in the late 1970s and early 1980s were evident from the fact that short-term interest rates were pushed above nominal GDP growth and above long term interest rates (see figure below), (Murphy, 1997).
Whereas this very tight monetary policy implemented by Paul Volcker is usually credited for having brought down the rate of inflation after 1980, the current policies are a sure way to hyperinflation. However, it is my view that the rate of inflation during Mr. Volcker’s reign would have come down regardless of monetary policies because strong price increases for all commodities between 1965 and 1980 had led to additional supplies, which after 1980 began to flood the market and depress prices. This was particularly true for oil, which had risen in price from $ 1.70 per barrel in 1970 to close to $ 50 per barrel in 1980. In addition, conservation efforts all over the world had curtailed demand. Finally, the fourth Kondratieff price wave, which had turned up in the 1940s was due to reach its plateau between 1975 and 1985, and then to turn down, since each phase of the long wave lasts between 22 and 30 years (according to Nikolai Kondratieff the ideal length of the long wave cycle, which consists of a rising and falling wave is between 45 and 60 years).
Therefore, the combination of rising supplies, energy conservation, and diminishing purchasing power on the side of households (because of inflation exceeding nominal income gains) would hve in the early 1980s - regardless of monetary policies - brought down the rate of inflation sooner or later (Murphy, 1997).
Will this recipe work now again and will we see history repeat itself this time around? I don’t think so.
With China and India we have two fairly well managed newly emerging super powers on the world scene whose appetite for commodities and resources is huge and shows no sign of subsiding. In addition both nations, which represent nearly half of the world’s population, are undertaking significant efforts to exchange their large USD reserves for all kind of resources. Mr. Bernanke has a real problem. For the first time in history he will not be able anymore to control the USD inflation through commodity prices. And this is quite concerning for anyone who would be in possession of USD denominated assets.
Figure 4: The United States of Greece,… sorry, the United States of America, and its debt spiraling out of control.
And for those of you who hope that the US economic performance (measured by the GDP) would have kept up with the growth in the US debt, please see the next chart in Figure 5. It clearly shows that - simply put – the US spends much more than it earns. Or in other words: the US behaves like a person who earns, say, 3000 USD a month but continuously spends 5000 USD a month and borrows the difference hoping that the lenders won’t blink and continue to trust blindly into the person’s ability to repay once a day the debt. For a private individual or company such a behavior would be a recipe for financial disaster and ultimately bankruptcy. For the US government – because it is a government – bankruptcy is not its destiny, as it has one way out: it can print money and by the way of (hyper)inflation cause a reduction in debts. And this dear investor, is happening right now as you read these lines.
Who is going to pay the price? We, the consumer, the electorate, we who elected those politicians into power in the first place. At appears to me that the consumer should be doing what funds and other countries are doing already: get out of the USD and buy gold, Swiss Francs, Norwegian Krones and any other non-agricultural commodity.
Figure 5: The GDP of the United States of America, and its debt compared to GDP spiraling out of control. In plain English: the US spends much more than it earns, and that since more than 30 years.
When debts are as large as there are now, deflating prices and especially deflating asset prices would wreck havoc in the economic system and lead to massive defaults and bankruptcies. I may add that, as can be seen from figure 1, between 1950 and 1980 the debt to GDP remained largely constant. But after 1980, and in particular after Mr. Greenspan became Fed chairman in 1987, debt to GDP exploded. Therefore, it is not deflation that is the problem, but the preceding debt inflation for which the Fed's expansionary monetary policies are fully responsible. So, having created a monetary and debt monster, the Fed embarked starting 2001 – and still ongoing !! - in a huge money printing operation in order to avoid deflation.
With precisely one year left for the world and all of its inhabitants, at least according to the Mayans, not to mention on the day of the Winter Solstice, it is only fitting that US debt, net of all settlements for all already completed bond auctions, is now at precisely $15,182,756,264,288.80. Why is this relevant? Because the latest annualized US GDP, according to the BEA, was $15,180,900,000.00. Which means that, as of today, total US debt to GDP is 100.012%.
Congratulations America: you are now in the triple digit "debt to GDP" club and may rub elbows with Greece and other banana republics!
Naturally, this is using purely "on the books" data. If one adds the NPV of all US liabilities, and adjusts GDP for such things as today's housing contraction, then the magical triple digit threshold was breached long ago.
And here is the breakdown for the forensically inclined ones:
I. Total debt as of December 20: $15,131,979,264,288,80 (source):
II. Net cash settlement of all completed auctions: $50,777,000,000.00 (source):
Figure 6: The uptrend in commodity prices on all fronts is evident not only in this graph….
Figure 7: … but also here. All commodities have been increasing with virtually no exception.
Source: IMF database.
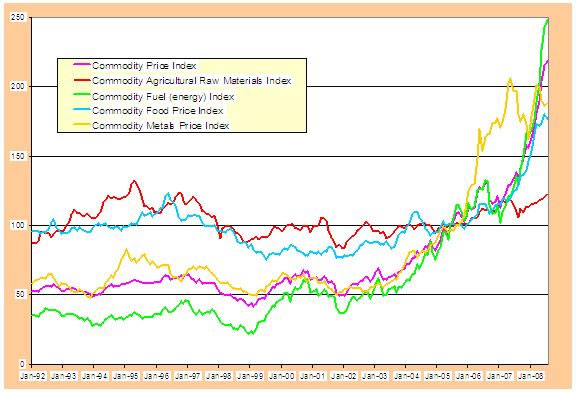
Note: The figure plots the following monthly Commodity Price Indices: (i) the Commodity Price Index (including both Fuel and Non-Fuel Indices), (ii) the Commodity Agricultural Raw Materials Index (including timber, cotton, wool, rubber, and hides), (iii) the Commodity Fuel Index (including crude oil, natural gas and coal), (iv) the Commodity Food Price Index (including cereals, vegetable oils, meat, seafood, sugar, banana, and orange), (v) the Commodity Metals Price Index (including copper, aluminium, iron ore, tin, zinc, lead and uranium). The index sets 2005 equal to 100.
But does this mean that commodity prices actually have been increasing when adjusted for inflation?
Figure 8: When adjusted for inflation (CPI) commodity prices have been actually shrinking, further emphasizing a significant investment opportunity for savvy investors.
The answer is clearly “No” as can be seen from the graph in Figure 8.
While we may argue about the severity and ultimate duration of the ongoing slowdown in the Chinese and the Indian economy, it is clear that the incremental demand for commodities from China and India will at least support commodity prices above their level reached in 2006, when the price of most industrial commodities were 50% lower than they are today. I may add that by 2001, commodity prices had been in a bear market for the last 25 years, and had reached in real terms (adjusted for inflation) the lowest level in the history of capitalism (see Figure 8). In other words, even taking a negative view of the world's economic outlook, it would seem that the secular bear market in commodities, which began in 1980, has come to an end and that from here on we shall see significantly higher commodity prices. So, even a third rate economist should see the difference between today's situation and that of the early 1980s - this especially if he were optimistic about the global economy, which would sustain demand for raw materials. So, whereas in the early 1980s commodity prices and interest rates began to decline from a secular point of view, it would appear that commodities and interest rates have begun to rise and have entered a long-term uptrend.
Where are commodity prices headed next in the short-term?
Alas, the short-term forecasting of commodity prices has doggedly resisted an armada of technical approaches. In a speech (Bernanke 2008), Federal Reserve Chairman Ben Bernanke highlighted the difficulty in obtaining a meaningful gauge for future commodity price movement. He noted especially the inadequacy of price forecasts based on signals obtained from commodity futures, and emphasized the importance of finding alternative approaches to forecast commodity market movements.
In another paper (Chen, Rogoff and Rossi, 2008), it was demonstrated that a carefully chosen set of exchange rates, those we call "commodity currencies", may indeed offer such an alternative approach to the forecasting of commodity prices.
Using data obtained over the past one to three decades for Australia, Canada, Chile, New Zealand, and South Africa - all commodity exporters with market-based floating exchange rates – it was found that their currencies embody remarkable forecasting power for future global commodity price movements. Individually, these exchange rates can forecast the prices of their country's major commodity exports, and together, they do an excellent good job at predicting aggregate commodity market movements. So, the interested investor may indeed use those combined currencies as short-term forecasting tools for commodity
There are several more fundamental differences between the early 1980s, which led to the Reagan boom and today's economic conditions. When in 1980, Mr. Reagan became President of the US, the debt to GDP ratio stood at around 130% and was not meaningfully higher than in the 1950s. In fact, from the figure below, we can see that until the 1980s, one dollar of additional debt boosted GDP by about $ 0.70. But now, with debt at close to 330% of GDP, one dollar in additional debt only leads to an increase in GDP of about $ 0.25!
Figure 9: Total Credit Market Debt and GDP
Source: Courtesy of Barry Bannister of Legg Mason in Baltimore
We can, therefore, say that today, because of excessive debts in the system, debt growth and fiscal deficits are far less effective at stimulating the economy than they were at the time of President Reagan. In fact, I would argue that for monetary policies the "Mother of all Monetary Tests" is unfolding right now, as it may be that monetary stimulus is no longer going to boost the economy, but inflation alone, which would lead in a benign scenario to stagflation and in a worst case scenario to a inflationary depression a la 1980s in Latin America. I should add that a deflationary recession/depression remains a possibility, although not a very likely one given the Fed's monetary policies, Mr. Bernanke's track record at tackling every economic discomfort with an additional injection of liquidity, and Mr. Bernanke's recent statements about the Fed's ability to print money.
Another difference between the early 1980s and today's conditions relates to the US dollar. In the early 1980s the US dollar had become significantly undervalued following its steep decline against hard currencies after President Nixon had closed the gold window in August 1971 (see figure below). Today, however, the situation is fundamentally different (Groenfeldt, 2001). Even if one could argue against all reasonable knowledge that the US dollar is about where it should be against the Euro, the dollar is certainly grossly over-valued against the Asian currencies.
More to the point, whereas in the early 1980s a dollar rally unfolded at the same time the US had growing trade and fiscal deficits, today even larger trade and fiscal deficits are more likely to lead to additional dollar weakness - not strength. I may add that I feel that the dollar has about the same downside risk against the Asian currencies as it had in 1971 against the European currencies, against which it then declined by 70% in the course of the 1970s and led to its early 1980 under-valuation.
Needless to say that additional dollar weakness would add to inflationary pressures and intensify the trend toward higher interest rates, and certainly would intensify also the upward pressure on commodity prices.
The last fundamental difference between the early 1980s and today concerns not only the stock market and housing market in the US, but also most stock and property markets around the world. In 1982, the Dow Jones Industrial Average was no higher than it had been in 1954, and adjusted for inflation it was down by 70%. How inexpensive equities were relative to the overall price level and especially against commodities is evident from the gold to Dow Jones Ratio. In 1980, with one ounce of gold you could have bought one Dow Jones Industrial Average. Today, however, it takes about 25 ounces of gold to buy one Dow Jones Industrial Average, suggesting that US equities are not particularly cheap (or very expensive, as I believe, compared to gold). Moreover, in 1982, stocks sold below their book value and had a dividend yield of 7%! Compare that with today! Equally property markets around the world were depressed in the early 1980s, due to sky-high interest rates. Today, real estate markets, around the world all exhibit symptoms of bubbles, including Germany and China, despite the correction in the Anglo-Saxon countries. And one could build a case that even in the Anglo-Saxon countries real estate values are still overpriced, something which is vehemently denied by governments but markets seem to think the contrary as otherwise the ongoing depression in real estate prices would not be existing? Right, Mr. Bernanke?
Finally, in the early 1980s, consumers had a pent-up demand for goods and services following the 1980/81 and 1982 recession. Their saving rate was above 9%, whereas today, we have no pent-up demand whatsoever, and there are on the household level practically no savings. So, whereas in 1982, the then existing pent up demand led to a strong consumption led recovery, today, the over-leveraged consumer may actually, as some recent economic indicators seem to indicate lead - if not to a consumption slump - then at least to a slowdown in the growth of consumer expenditures (Roach, 2004).
We can see that today's economic conditions in the USA are widely different than what we had in the early 1980s. In particular, today's debt load, the vulnerable position of the US dollar against the Asian currencies, the long-term price cycle in terms of commodities and interest rates likely to have bottomed out and having embarked on a rising trend, the consumer's debt load, and stock valuations are such that a sustainable healthy recovery is unlikely to shape our future. In fact, I would argue that conditions are now so blatantly different that only a significantly lower US-Dollar (at around 1.90 to 2.10 versus the Euro) would balance conditions. And that exactly seems to be part of a not yet publicly known master plan of the US administration. It looks like the US strategy in the transcontinental currency battle is to give the Euro's masters what they want - except way too much of it, way too quickly, in order to overload the euro system and make it collapse.
The US could reach two goals with that strategy: one, preserve the worldwide dominance of the USD, and two, keep that worldwide dominance despite the massive debt and inflation problems in the US economy.
God, I love those guys. They are really smart and could even accomplish their goal while the Europeans commit economic suicide by the means of procrastination and bickering.
The ECB was instituted by the Euro's creators to preside over an orderly transition away from a dollar-dependent world to a more versatile arrangement wherein the Euro fulfills a quasi-reserve function that will eventually give way to gold being the ultimate international currency reserve, with all the fiats freely floating against gold instead of against each other. That is the theory of course and could even work, if the Europeans had more
But the road there is a long and winding one, and not even all of those currently "in charge" (international central bankers) are fully aware that this is the ultimate goal (to understand that remark I recommend reading a summary of the confusing public statements by the Austrian Nationalbank from 2001 to 2004). Rather, that unstated goal was wrapped up implicitly in the ECB's role of guaranteeing price-stability, rather than using interest rates to jump-start an otherwise faltering economy like the Fed does in the USA.
"Price-stability" mans that the currency is intentionally not used as a means for gunning Euroland's economic engines. This goal is designed as a precaution to avoid the excesses caused by overprinting, which has been the US' main tool for papering-over any possible recessions, or even looming depressions - so far. So far, the US model has "worked" - but only to the point where the resulting trade and investment imbalances are about to do the dollar in altogether.
We now find ourselves at a juncture where the US (in its efforts to continue to paper-over its excesses and their consequences) absolutely MUST have a lower dollar. A lower dollar has the twin benefits of (a) lowering the monstrous current account deficit (reflecting trade plus investment-flow imbalances), and (b) propping up the competitiveness of US exporters, hopefully leading to more investment by these firms, and eventually to increased employment.
The US-Fed and US administration know that the Euro's ultimate aim is by necessity to slowly attract foreign investors and central banks to the euro and away from the dollar. But they also know that any strong upward move of the Euro will have major negative consequences on the Europeans' economies. As a result, it looks like the US game is to allow the dollar to drop lower - and faster than the Europeans' fragile economies can absorb, largely helped by bickering and partly blatantly incompetent European governments.
What the newspapers and financial commentators call a policy of "benign neglect" turns out not to be so benign at all: by pursuing its current strategy, the dollar-establishment is killing three birds with one stone: they get the benefit of (1) higher US export-competitiveness and better economic performance, (2) simultaneously lower EU export competitiveness resulting in European economic stagnation, and (3) shifting the entire burden of smoothing out the dollar's Forex movements onto the Europeans' backs. In essence, the dollar faction is playing a game of "chicken" with the Europeans.
So, who is winning? Is the US winning by figuratively letting go of the rope the ECB is pulling on in order to make them fall on their collective behinds? Or is it the ECB and the rest of the world, by having the last laugh because they hold in their hands the key to blowing the US economy sky-high?
Remember that the Asians, particularly China and Japan, hold huge amounts of dollar-claims in the form of Treasury debt. If they decide to accelerate their selling, US debt prices will collapse and long term rates will explode past the US' point of tolerance. The certain consequences will be a significant reduction of US purchases of Asian products.
The lower the US lets its currency fall, the more temptation the Asians feel to dump their US debt holdings, as they see their US "assets" depreciate with every tick lower by the dollar on its journey into Forex "Hades." At some point, this temptation will become overwhelming. The US is currently betting that the Asians' point of no return comes after that of the Europeans. I personally don't think that's a safe bet to make.
No matter which way this battle turns out, if you put a good portion of your assets in gold, you can afford to sit on the sidelines and simply "watch the game." Whoever wins or loses, you will be (economically, at least) safe from the carnage on the playing field, that will most certainly unfold on either side of the Atlantic.
By Volkmar Hable
volkmar@hable.ca
Dr. Hable is a physicist and geoscientist by training and in addition holds a B.Sc. in Agriculture and Agronomics. In 2011 he has been appointed Consul for the Republic of Guinea.
From 1996 to the beginning of 2001, he was the CEO for the European operations of Adecco, a Swiss $20 billion dollar Fortune 500 Company where he managed its offices in Europe and some parts of Asia comprising of 6,000 employees. From 2001 to 2009 he was a fund manager and asset advisor for STG Ltd, a private Swiss 700 million Euro fund focusing on energy, commodities and resources; during this time Dr. Hable managed to achieve an annual average net return of 19.8% with no down year. In December 2011 the Swiss group awarded him with the Liftetime Fund Manager Award. Previously he held senior executive positions in the oil exploration industry with Western Geophysical, the Diplomatic Corps, and a global Engineering Consulting Company. He is fluent in English, Spanish, German and French. Professional focus areas include geology & mining engineering, particle & molecular physics, robotics.
If you would like to send me a message please use the contact form on www.samariumgroup.com
Copyright © 2012 Dr. Volkmar “Marc“ G. Hable - All Rights Reserved Disclaimer: The above is a matter of opinion provided for general information purposes only and is not intended as investment advice. Information and analysis above are derived from sources and utilising methods believed to be reliable, but we cannot accept responsibility for any losses you may incur as a result of this analysis. Individuals should consult with their personal financial advisors.
© 2005-2022 http://www.MarketOracle.co.uk - The Market Oracle is a FREE Daily Financial Markets Analysis & Forecasting online publication.