Crude Oil Supply & Demand Outlook Remains Favorable for Producers
Commodities / Crude Oil May 01, 2012 - 03:33 AM GMTBy: Elliot_H_Gue

 My outlook for crude oil prices remains relatively unchanged since the beginning of 2012. Potential demand destruction brought on by persistently high oil prices should limit upside for oil prices.
That being said, don’t assume that US oil demand is collapsing because of elevated oil prices and sluggish economic growth.

Source: Energy Information Administration
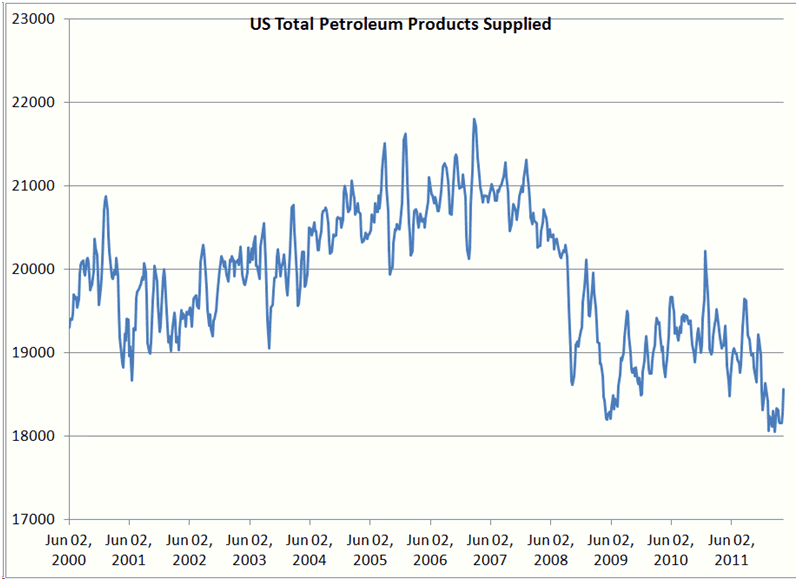
This graph tracks the four-week moving average of petroleum product supplies, a measure that includes heating oil, jet fuel, gasoline and diesel. US oil consumption collapsed during the Great Recession and financial crisis of 2007-09 and has never fully recovered. But consumption has held relatively steady; the most recent data indicates that US oil demand is down about 2 percent year over year.
However, the near-term trend is surprising. Despite elevated prices, US oil demand appears to have picked up over the past two weeks--a sign that consumers have grown accustomed to higher prices. These revised expectations are also reflected in March’s stronger-than-expected retail sales data.
Meanwhile, rising oil consumption in China and other emerging markets continues to drive global demand for oil and refined products. The International Energy Agency (IEA) estimates that global oil demand will expand by 800,000 barrels day in 2012--and there could be more upside to this number when you consider that the International Monetary Fund recently raised its outlook for 2012 global economic growth to 3.5 percent from 3.3 percent.
Bottom line: Spikes in the price of Brent crude oil to more than $120 per barrel would probably slow aggregate demand growth, while dips to less than $110 per barrel would encourage consumption.
The supply side of the equation likewise supports elevated prices.

Source: Energy Information Administration
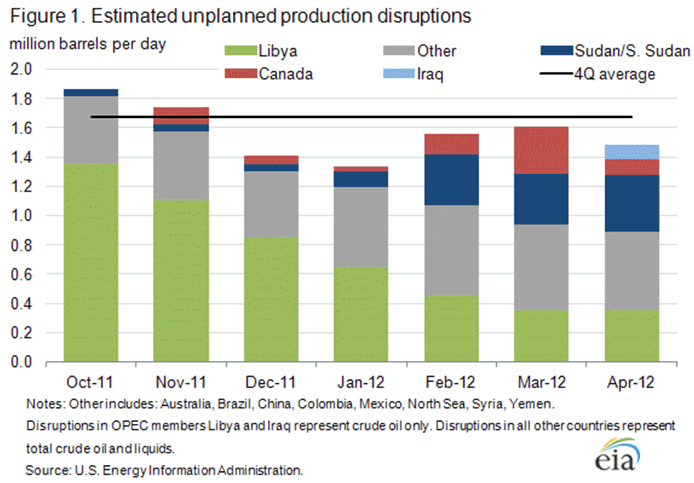
This graph tracks the total number of unplanned outages in global oil production. Shortsighted pundits argued that the restoration of Libyan oil exports would lower oil prices in early 2012.
Libyan supply disruptions (in green) have declined to less than 0.4 million barrels per day as of April this year from roughly 1.4 million barrels per day in October 2011. (Mea culpa: I didn’t expect the nation to restore its oil output in such rapid fashion.)
But supply disruptions elsewhere have almost completely offset these unexpected gains. The Elgin spill has disrupted production in a portion of the North Sea, while a simmering pipeline dispute between Sudan and South Sudan in Africa has also weighed on output. South Sudan achieved independence in July 2011, but the two countries failed to agree upon pipeline transit fees for oil crossing the new border. The resulting dispute prompted South Sudan to shut in about 400,000 barrels per day oil production in January.
The IEA estimates that non-OPEC crude oil production slipped by 500,000 barrels per day in March, and the agency’s revised forecast calls for this output to increase by 700,000 barrels per day on the year. With demand growing faster than non-OPEC supply, the global oil market remains tight; the world will need to rely on additional output from OPEC to fill the gap.
Within OPEC, Saudi Arabia is the sole member that has significant spare capacity. At present, the organization’s total effective spare capacity stands at less than 3 million barrels per day--a drop in the bucket in a global oil market of almost 90 million barrels per day.
Elevated oil prices have little to do with speculation: A tight supply-demand balance ensures that oil prices have ample support.
My updated forecast calls for the price difference between West Texas Intermediate (WTI) and Brent crude oil to narrow in coming months. WTI has historically commanded a premium of $1 to $2 per barrel relative to Brent, but the relationship has reversed in recent years. At the peak difference between the two benchmarks, Brent crude oil traded at levels that exceeded the price of WTI by almost $30 per barrel.
This anomaly stemmed from local logistical constraints that combined to glut the oil hub of Cushing, Okla., the official delivery point for WTI.
On April 18, 2012, Enterprise Products Partners LP (NYSE: EPD) (See my analysis of EPD here) announced that the reversal of its Seaway Pipeline is running ahead of schedule and will be completed by late May instead of late June. The reversed pipeline will transport crude oil from Cushing to the Gulf Coast, where price realizations are much higher. Although the Seaway Pipeline lacks sufficient capacity to eliminate the glut of oil at Cushing, this much-needed escape valve should reduce the spread between WTI and Brent crude oil.
I continue to expect Brent crude oil to fetch an average of roughly $110 per barrel in 2012, while a barrel of WTI should average more than $100 per barrel. These price ranges should ensure that oil-weighted producers reap sizable profits and encourage drilling activity. Check out Shale Oil and Gas: Energizing the US Economy, for further analysis on US shale oil and gas production.
Mr. Gue is also editor of The Energy Strategist, helping subscribers profit from oil and gas as well as leading-edge technologies like LNG, CNG, natural gas liquids and uranium stocks.
He has worked and lived in Europe for five years, where he completed a Master’s degree in Finance from the University of London, the highest-rated program in that field in the U.K. He also received his Bachelor’s of Science in Economics and Management degree from the University of London, graduating among the top 3 percent of his class. Mr. Gue was the first American student to ever complete a full degree at that business school.
© 2012 Copyright Elliott H. Gue - All Rights Reserved
Disclaimer: The above is a matter of opinion provided for general information purposes only and is not intended as investment advice. Information and analysis above are derived from sources and utilising methods believed to be reliable, but we cannot accept responsibility for any losses you may incur as a result of this analysis. Individuals should consult with their personal financial advisors.
Elliott H. Gue Archive |
© 2005-2022 http://www.MarketOracle.co.uk - The Market Oracle is a FREE Daily Financial Markets Analysis & Forecasting online publication.


