


IBM Proving That Value Investing Is Not A Form Of Market Timing
Companies / Investing 2012 May 08, 2012 - 03:22 PM GMT

 Throughout my career, I have often come across those who believe that value investing is a form of market timing. This misconception seems to be based on the notion that since a value investor determines the price above which they are not willing to pay for a stock, that they are in effect timing the market. The fallacy in this logic is that value investors are not concerned with price, they are concerned with valuation. Therefore, I offer this article as an attempt to clarify the differences between timing the market versus behaving as a value investor.
The biggest difference pertains to what is being focused upon. The true value investor is focused on the intrinsic value of the business behind the company or stock they are interested in. To the value investor, the True Worth™ of a company is represented by the rate of return that the earnings and cash flows of the business are capable of generating on their (stockholder's) behalf. Therefore, their time and focus is spent on analyzing the fundamental value of the business. As I often do, I will look to the Oracle of Omaha to find what the king of value investors has to say about this subject:
"I never attempt to make money on the stock market. I buy on the assumption that they could close the market the next day and not reopen it for five years." Warren Buffett
"The market is there only as a reference point to see if anybody is offering to do anything foolish. When we invest in stocks, we invest in businesses." Warren Buffett
The two above quotes really crystallize some of the key differences between a value investor and a market timer. The true value investor, like Warren Buffett, doesn't care if they close the market the day after he buys a stock and not open it for five years because he doesn't plan on selling the business. In other words, he's not really worried about what the price may or may not do over the shorter run; his concern is with how much money the business behind the stock will make him over the years.
And of course the second quote simply reiterates the idea of investing in the business, not the stock. The true value investor understands that as long as the business is strong and performs well, the stock price will eventually seek its True Worth™, it's only a matter of time. Therefore, they are never forecasting what the price is going to do, but they spend a great deal of time and effort forecasting what they believe the business will do.
In contrast, the market timer is focused mainly on price, and what they believe the price movement is going to be over the short run. In other words, they are concerned with whether they think the price is going to go up or going to go down, and therefore usually have little concern or even much interest in what the business may or may not be doing. More simply stated, they are spending their time forecasting what the price of the stock is going to do in contrast to what the business may or may not do. I consider this folly, because my experience has shown that stock prices are both volatile and unpredictable.
In order to illustrate my point, I'm going to draw on the perspectives provided by F.A.S.T. Graphs™ on the tech blue-chip International Business Machines (IBM) that will illustrate the differences between a value investor and a market timer. To accomplish this, I will analyze IBM first through the eyes of a market timer, then through the eyes of a value investor.
A Hypothetical Analysis of IBM as a Market Timer
As I mentioned in my opening remarks, market timers are solely concerned with price and price movement. Furthermore, and perhaps unfortunately, I believe there are a lot more market timers out there than there are value investors. Some evidence of this last fact can be seen by examining the majority of stock charts available on the Internet. The vast majority plot and graph price only. The following stock price chart only on IBM offers a typical example.
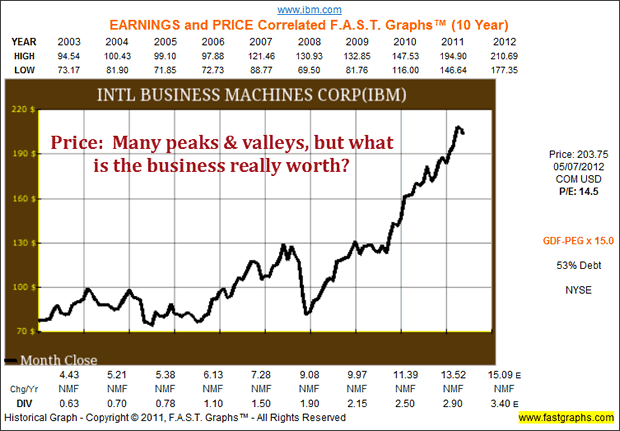
To the market timer focused on price, the IBM stock price chart could easily be interpreted as follows: First of all, the market timer might consider that IBM is not a good buy because it's selling at a price that's very close to its 52-week high. Furthermore, they might also say that the stock has had a large run-up and therefore is no longer a good buy. On the other hand, the market timer may see IBM as a momentum stock and forecast that price may go higher on momentum. Or, since we had a few down days, market timers may be calling for a pullback. Nevertheless, their opinions will be primarily driven by price action.
To reiterate and summarize, the market timer will utilize a lot of metrics that are based solely on price. Examples would include 150-day moving averages, 52-week highs and of course various forms and methods of technical analysis. The problem that I have always found with this kind of price-based analysis is that it is long on information and short on wisdom.
The only thing that I can ever say with confidence about stock price charts are that they will always draw a jagged picture of volatility. Although many attempt to divine some wisdom amongst the chaos and disarray, I contend that short-term movements are erratic and unpredictable. Therefore, I believe that a successful forecast of the next direction in stock price is more a function of luck than analysis. Of course, many market timers will disagree.
A Hypothetical Look at IBM as a Value Investor
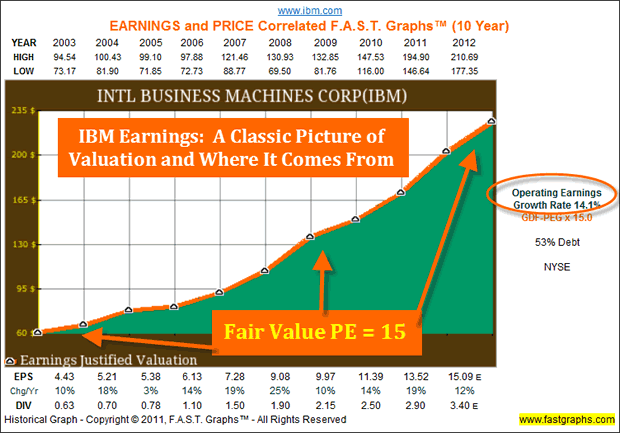
The following earnings only F.A.S.T. Graphs™ on IBM looks at the same investment only this time from the perspective of the business with no regard to price. The orange line on the graph plots IBM's earnings per share since calendar year 2003 to include an estimate for 2012. Using a widely accepted formula for valuing a business based on earnings and cash flows applies a valuation multiple (PE ratio) of 15. So that the reader is clear, there are two primary things that are important about the orange earnings justified valuation line.
First of all, the orange earnings justified valuation line paints a picture of a very consistent and fast-growing business since 2003 (note the operating earnings growth rate of 14.1% to the right of the graph). In other words, we instantly see a picture of a really good business, and price has not yet even entered the equation. Second, we see a picture that represents a proxy of fair evaluation on IBM (the orange earnings justified valuation line).
Although there is a mathematical justification that validates where and how this orange line is drawn, I would like to avoid mathematical equations in favor of concept. What the essence of this fair valuation line represents, is a valuation level where the prospective investor earns an earnings yield that justifies the risk of investing in the business. In other words, this line is not intended to tell you where the price of the stock is going to go; instead, it is designed to draw a picture where the earnings themselves of the business provide an adequate return to shareholders.
More simply stated, if the stock price is touching this line, then fair value is evident. And of course, if the price is above this orange line then earnings would not justify the investment, and if the price is below this orange line a real bargain exists. Moreover, the higher the price is above the orange line the greater the overvaluation, and the more the price is below the orange line the greater the bargain. Therefore, the true value investor is primarily focused on this orange line, and stock price is only brought into the equation in order to determine whether or not the value investor can buy the business at a sound price or not. But the value investor is not forecasting price, the value investor is forecasting future business growth and looking for bargains.
Although I would argue that the earnings only graph provides more wisdom with its information than a price only graph does, I would also admit that it is still longer on information and shorter on true knowledge. In my opinion, it is only when the two graphs are combined (earnings and price) that the information relative to each other begins to provide real knowledge that becomes wisdom. Neither a price graph alone nor an earnings only graph can provide an accurate basis that depicts a sound rationale as to whether to buy, sell or hold.
Value Investing Versus Market Timing Bringing It Together
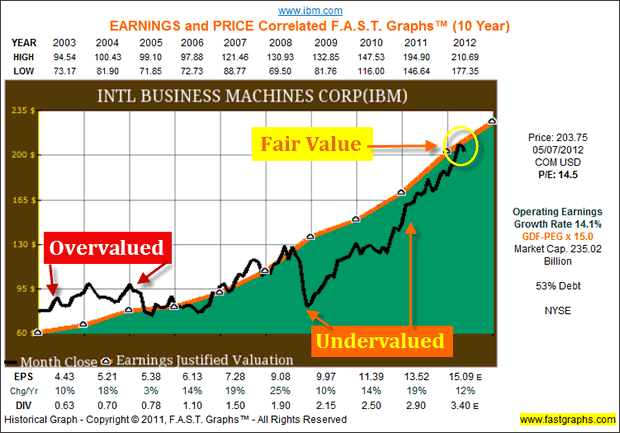
This next graph, which is a combination of price and earnings, clearly illustrates my point. In this graph we have overlaid monthly closing stock prices in correlation to the orange earnings justified valuation line and discover some very important and enlightening relationships between the two. When we examine price and earnings simultaneously, we discover wisdom and knowledge that can help us make better investment decisions.
First of all, we see that in the longer run price does move in the general direction of earnings. Moreover, notice what happens when the price is overvalued, or above the earnings line, it inevitably comes back into alignment with the earnings justified valuation. Conversely, notice what happens when the price is undervalued or below the earnings line. Once again it inevitably is drawn back to the earnings justified level. And, over the long run, it is clear that where earnings go stock price is sure to follow.
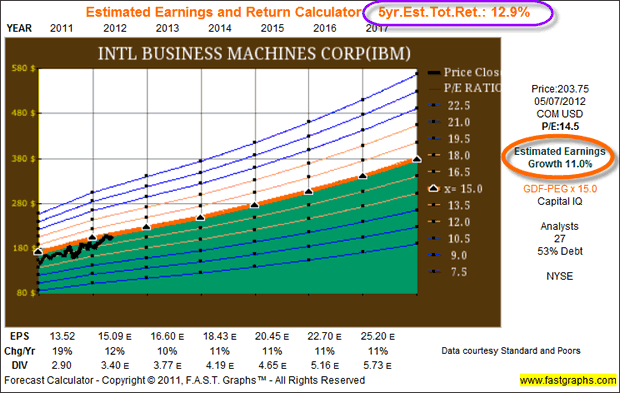
Thus far, I've attempted to illustrate my point graphically. However, I believe it is valuable to at least understand some of the basic mathematical principles behind the pictures. The following Estimated Earnings and Return Calculator shows that a consensus of 27 analysts reporting to Standard & Poor's Capital IQ forecast IBM to grow earnings at 11% per annum over the next five years. Therefore, IBM appears to be fairly valued (price is touching the future estimated orange earnings justified valuation line). This is in spite of the strong price advance over the last 3-plus years because in December of 2008 IBM's stock price was extremely undervalued. Therefore, most of the price advance that occurred has been from stock price catching up to fair value.
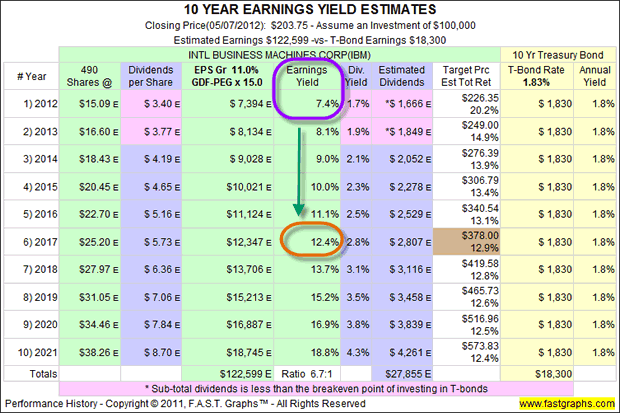
My final graphic, the 10-year Earnings Yield Estimates table takes the above graphic and provides the numerical justifications for why the orange line represents fair value. The green column marked earnings yield shows that at today's prices IBM stock offers investors a starting earnings yield of 7.4% (purple circle). Furthermore, based on the expectations for growth cited above, future earnings yields are expected to expand significantly, assuming the earnings growth estimates are achieved. By calendar year 2017 future earnings yield would expand to 12.4% (orange circle) thereby compensating investors for their risk.
In addition to the potential growth of earnings yield, the table also provides an estimate of growth of dividend yield (yield on cost) and a calculation of future target prices based on price following the orange line (earnings estimates). Finally, for perspective on the risk reward ratio, a comparison with investing in 10-year Treasury bonds is provided by the yellow columns.
Summary and Conclusions
The primary goal of this article was to provide a rational explanation about the differences between market timing versus value investing. Market timing deals with attempting to forecast where the next movements in price are going to go and occur. The only concern that the true value investor has with price is as a measurement as to whether or not it represents fair value relative to fundamentals (earnings). Therefore, although price movement either validates or invalidates the market timer's investing strategy, it is not even of interest to the true value investor.
As I have stated in past writings, both the true value investor and a competent mountain climber both realize that the only way to the highest peak is by the willingness to traverse through several valleys along the way. However, calculating the intrinsic value of a business based on fundamentals and then not being willing to invest in the business unless the valuation justifies the price, is not market timing. Instead, it is applying sound and proven principles of business economics and accounting to the investment process.
At the end of the day, the value investor does not validate their decision based on price movement. In fact, if price falls after they buy, and they feel their original decision was based on sound fundamental values, the reaction would be to buy more. Furthermore, if price rises right after they buy they do not immediately pat themselves on the back and assume they were right. It is only when earnings and dividends continue to advance that the real value investor believes that they've made the correct decision.
Disclosure: No position at the time of writing.
By Chuck Carnevale
Charles (Chuck) C. Carnevale is the creator of F.A.S.T. Graphs™. Chuck is also co-founder of an investment management firm. He has been working in the securities industry since 1970: he has been a partner with a private NYSE member firm, the President of a NASD firm, Vice President and Regional Marketing Director for a major AMEX listed company, and an Associate Vice President and Investment Consulting Services Coordinator for a major NYSE member firm.
Prior to forming his own investment firm, he was a partner in a 30-year-old established registered investment advisory in Tampa, Florida. Chuck holds a Bachelor of Science in Economics and Finance from the University of Tampa. Chuck is a sought-after public speaker who is very passionate about spreading the critical message of prudence in money management. Chuck is a Veteran of the Vietnam War and was awarded both the Bronze Star and the Vietnam Honor Medal.
© 2012 Copyright Charles (Chuck) C. Carnevale - All Rights Reserved Disclaimer: The above is a matter of opinion provided for general information purposes only and is not intended as investment advice. Information and analysis above are derived from sources and utilising methods believed to be reliable, but we cannot accept responsibility for any losses you may incur as a result of this analysis. Individuals should consult with their personal financial advisors.
© 2005-2022 http://www.MarketOracle.co.uk - The Market Oracle is a FREE Daily Financial Markets Analysis & Forecasting online publication.