Five Consumer Staple Stocks For A Hearty Investment Portfolio With Yield
Portfolio / Sector Analysis May 11, 2012 - 02:09 AM GMTBy: Fast_Graphs
 The old adage that people got to eat apply to the five consumer staple companies covered in this report. From the farm to the table these companies provide sustenance to a hungry world. Therefore, we believe that conservative investors that are craving the opportunity for growth and income might want to look closer at these five consumer staples. Each appears to be reasonably priced, and the group provides various combinations of growth and yield.
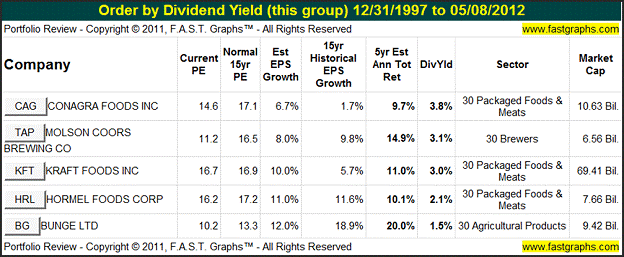
The following table summarizes five consumer staple companies that appear to be attractively valued, and lists them in order of dividend yield highest to lowest. From left to right, the table shows the company’s stock symbol and name. Next, two valuation metrics are listed side-by-side, the current PE ratio followed by the historical normal PE ratio for perspective. Then the five-year estimated earnings per share growth is shown next to each company’s historical EPS growth providing a perspective of the past versus the future growth potential of each company. The final three columns show the current dividend yield, the company sector and its market cap.
A Closer Look at the Past and the Future Potential
Since a picture is worth 1,000 words, we’ll take a closer look at the past performance and future potential of each of our five candidates through the lens of F.A.S.T. Graphs™.
Earnings Determine Market Price: The following earnings and price correlated historical graphs clearly illustrates the importance of earnings. The Earnings Growth Rate Line or True Worth™ Line (orange line with white triangles) is correlated with the historical stock price line. On graph after graph the lines will move in tandem. If the stock price strays away from the earnings line (over or under), inevitably it will come back to earnings. The historical normal PE ratio line (dark blue line with*) depicts a PE ratio that the market has historically applied.
The orange True Worth™ line and the blue normal PE ratio line provide perspectives on valuation. The orange line reflects the fair value of each company’s earnings relative to its growth rate achievement, and the blue line reflects how the market has traditionally valued the company’s stock relative to its fair value. The blue line represents a trimmed historical normal PE ratio (the highest and lowest PEs are trimmed). These lines should be viewed as barometers or aids for ascertaining sound buy, sell or hold decisions. Rather than seen as absolutes, they should be seen as guides to better thinking.
About Conagra Foods Inc (CAG): Directly from their website
“ConAgra Foods, Inc., (NYSE: CAG) is one of North America's leading food companies, with brands in 97 percent of America's households. Consumers find Banquet, Chef Boyardee, Egg Beaters, Healthy Choice, Hebrew National, Hunt's, Marie Callender's, Orville Redenbacher's, PAM, Peter Pan, Reddi-wip, Slim Jim, Snack Pack and many other ConAgra Foods brands in grocery, convenience, mass merchandise and club stores. ConAgra Foods also has a strong business-to-business presence, supplying frozen potato and sweet potato products as well as other vegetable, spice and grain products to a variety of well-known restaurants, foodservice operators and commercial customers.”
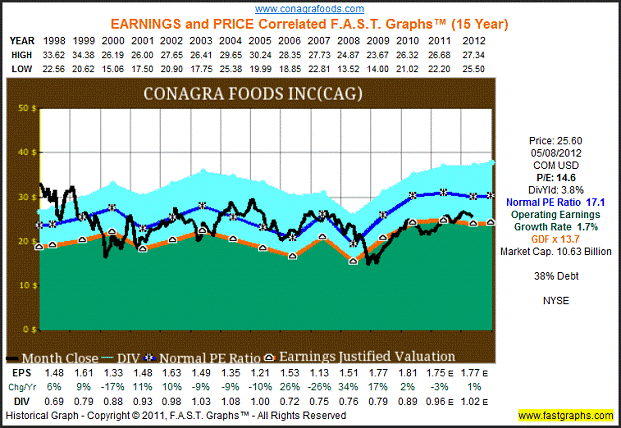
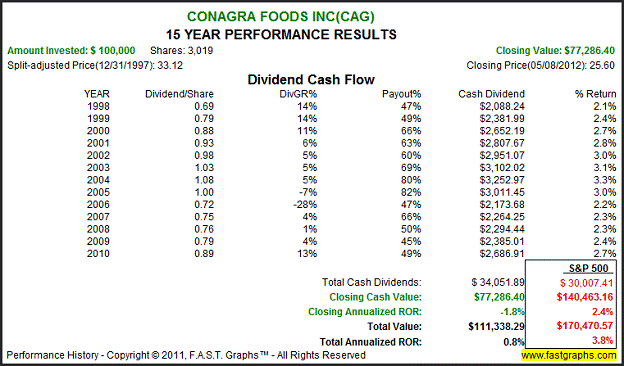
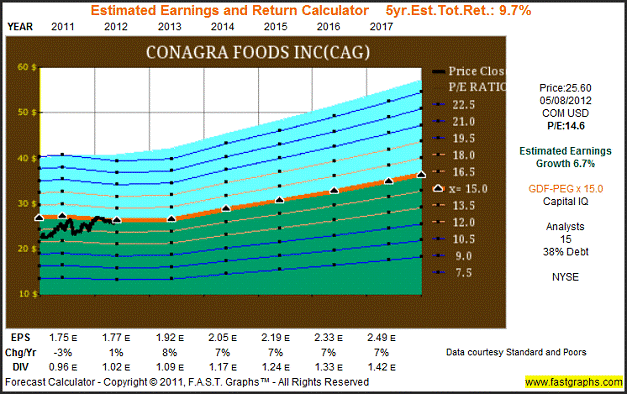
The consensus of 15 leading analysts reporting to Capital IQ forecast Conagra Foods Inc’s long-term earnings growth at 6.7%. Conagra Foods Inc has medium long-term debt at 38% of capital. Conagra Foods Inc is currently trading at a P/E of 14.6, which is inside the value corridor (defined by the five orange lines) of a maximum P/E of 18. If the earnings materialize as forecast, Conagra Foods Inc’s True Worth™ valuation would be $34.99 at the end of 2017, which would be a 9.7% annual rate of return from the current price.
About Molson Coors Brewing Co (TAP): Directly from their website
“Molson Coors Brewing Company is a leading global brewer delivering extraordinary brands that delight the world's beer drinkers. It brews, markets and sells a portfolio of leading premium brands such as Coors Light, Molson Canadian, Carling, and Blue Moon across The Americas, Europe and Asia. It operates in Canada through Molson Coors Canada; in the US through MillerCoors; in the U.K. and Ireland through Molson Coors UK; and outside these core markets through Molson Coors International. Molson Coors is listed on the Dow Jones Sustainability Index for North America and is constantly looking for ways to improve its Beer Print.”
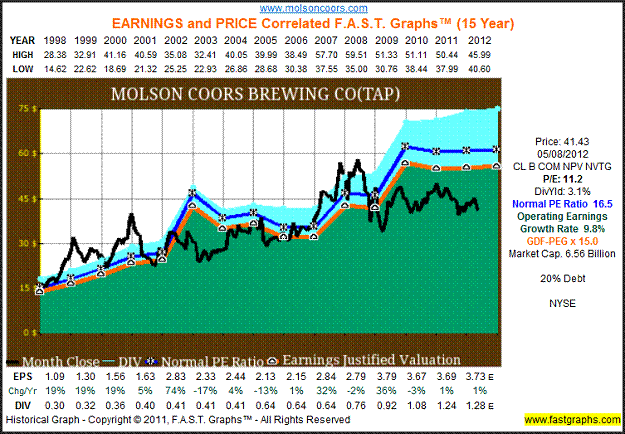
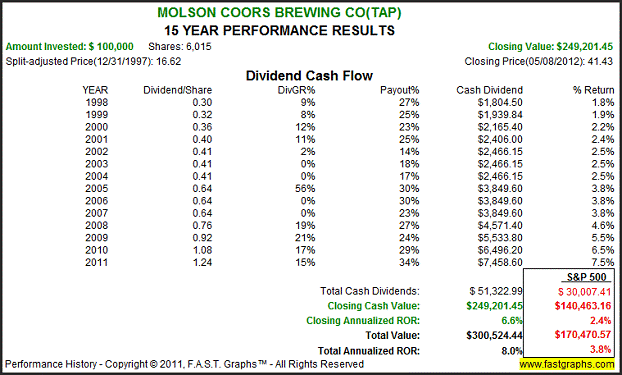
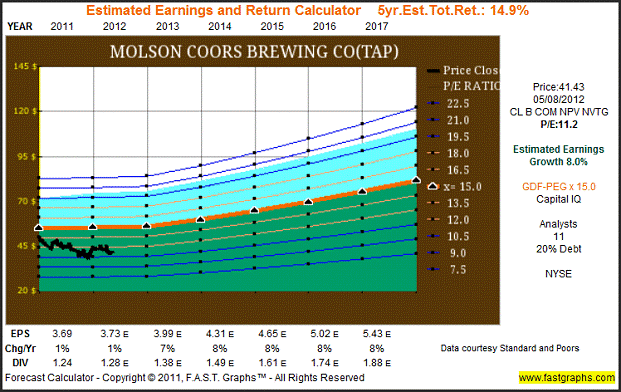
The consensus of 11 leading analysts reporting to Capital IQ forecast Molson Coors Brewing Co’s long-term earnings growth at 8%. Molson Coors Brewing Co has low long-term debt at 20% of capital. Molson Coors Brewing Co is currently trading at a P/E of 11.2, which is below the value corridor (defined by the five orange lines) of a maximum P/E of 18. If the earnings materialize as forecast, Molson Coors Brewing Co’s True Worth™ valuation would be $81.40 at the end of 2017, which would be a 14.9% annual rate of return from the current price.
About Kraft Foods Inc (KFT): Directly from their website
“Kraft Foods Inc. (NYSE: KFT)s a global snacks powerhouse with an unrivaled portfolio of brands people love. Proudly marketing delicious biscuits, confectionery, beverages, cheese, grocery products and convenient meals in approximately 170 countries, Kraft Foods had 2011 revenue of $54.4 billion. Twelve of the company's iconic brands – Cadbury, Jacobs, Kraft, LU, Maxwell House, Milka, Nabisco, Oreo, Oscar Mayer, Philadelphia, Tang and Trident – generate revenue of more than $1 billion annually. On Aug. 4, 2011, Kraft Foods announced plans to divide and create two independent public companies: a high-growth global snacks business and a high-margin North American grocery business. The transaction is expected to be completed before the end of 2012. A leader in innovation, marketing, health & wellness and sustainability, Kraft Foods is a member of the Dow Jones Industrial Average, Standard & Poor's 500, Dow Jones Sustainability Index and Ethibel Sustainability Index.”
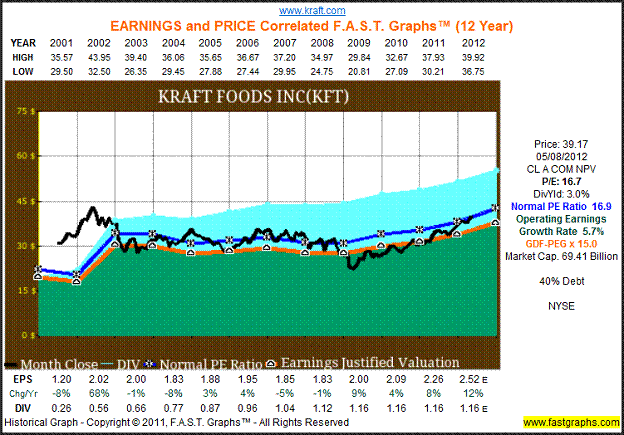
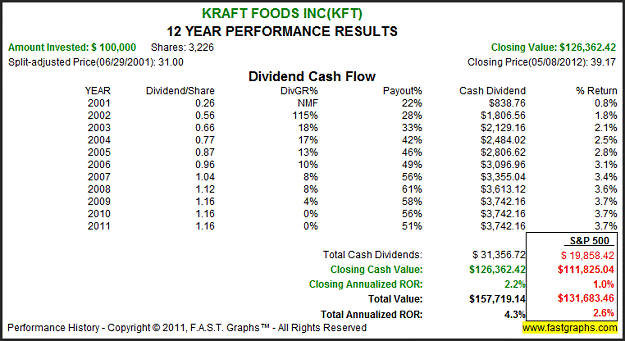
The consensus of 17 leading analysts reporting to Capital IQ forecast Kraft Foods Inc’s long-term earnings growth at 10%. Kraft Foods Inc has medium long-term debt at 40% of capital. Kraft Foods Inc is currently trading at a P/E of 16.7, which is inside the value corridor (defined by the five orange lines) of a maximum P/E of 18. If the earnings materialize as forecast, Kraft Foods Inc’s True Worth™ valuation would be $61.71 at the end of 2017, which would be a 11% annual rate of return from the current price.
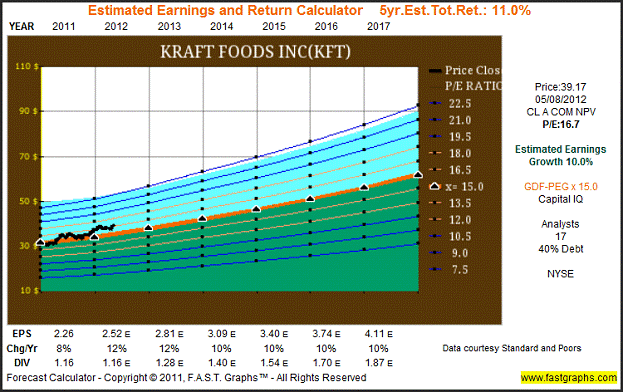
About Hormel Foods Corp (HRL): Directly from Google Finance
“Hormel Foods Corporation is engaged in the production of a range of meat and food products and the marketing of those products throughout the United States and internationally. The Company operates in five segments: Grocery Products, Refrigerated Foods, Jennie-O Turkey Store (JOTS), Specialty Foods, and All Other. Internationally, the Company markets its products through Hormel Foods International Corporation (HFIC), a wholly owned subsidiary. HFIC has a presence in the international marketplace through joint ventures and placement of personnel in foreign locations, such as Australia, Canada, the People’s Republic of China, Japan, and the Philippines. On October 26, 2009, the Company completed the formation of MegaMex Foods, LLC (MegaMex), 50 % joint venture, which markets Mexican Foods in the United States. Effective February 1, 2010, the Company completed the acquisition of the Country Crock chilled side dish business from Unilever United States Inc.”
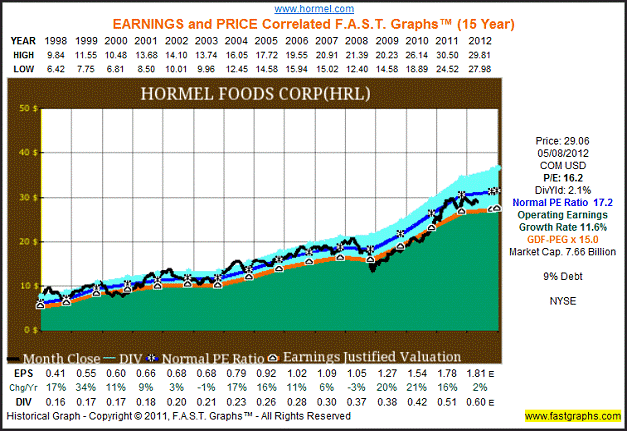
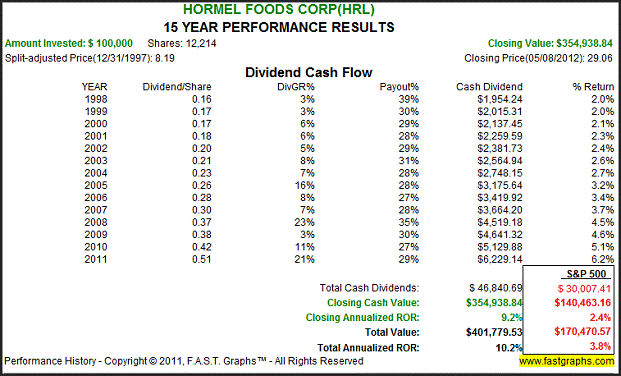
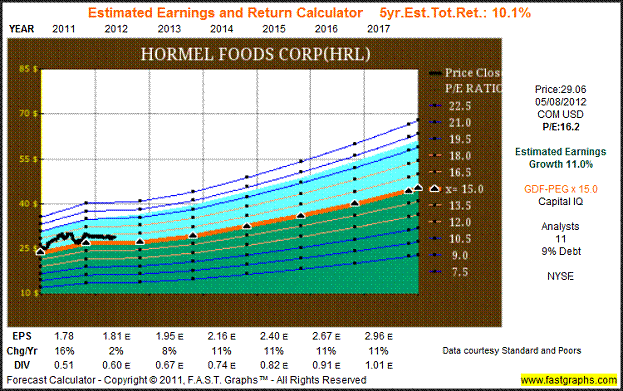
The consensus of 11 leading analysts reporting to Capital IQ forecast Hormel Foods Corp’s long-term earnings growth at 11%. Hormel Foods Corp has low long-term debt at 9% of capital. Hormel Foods Corp is currently trading at a P/E of 16.2, which is inside the value corridor (defined by the five orange lines) of a maximum P/E of 18. If the earnings materialize as forecast, Hormel Foods Corp’s True Worth™ valuation would be $44.40 at the end of 2017, which would be a 10.1% annual rate of return from the current price.
About Bunge Ltd (BG): Directly from their website
“Bunge Limited (www.bunge.com, NYSE: BG) is a leading global agribusiness and food company with approximately 32,000 employees in more than 30 countries. Bunge buys, sells, stores and transports oilseeds and grains to serve customers worldwide; processes oilseeds to make protein meal for animal feed and edible oil products for commercial customers and consumers; produces sugar and ethanol from sugarcane; mills wheat and corn to make ingredients used by food companies; and sells fertilizer in North and South America. Founded in 1818, the company is headquartered in White Plains, New York.”
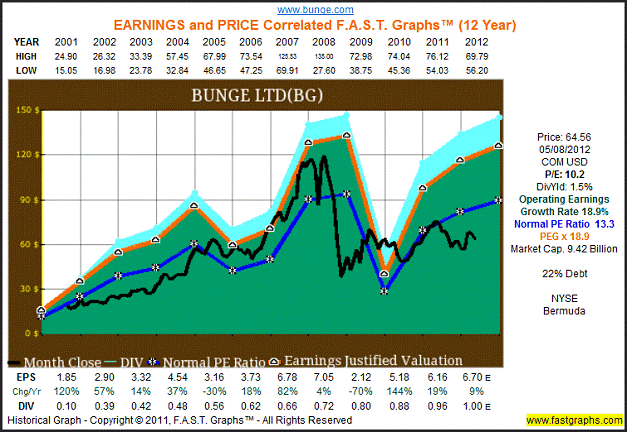
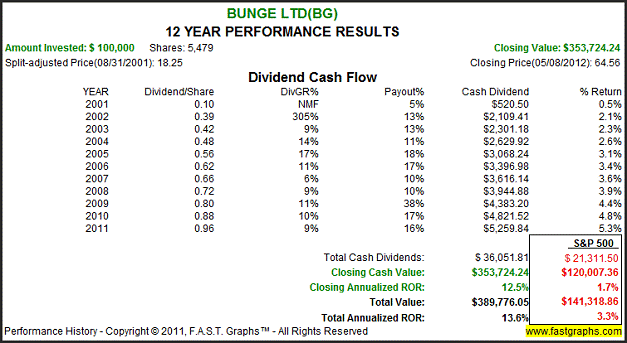
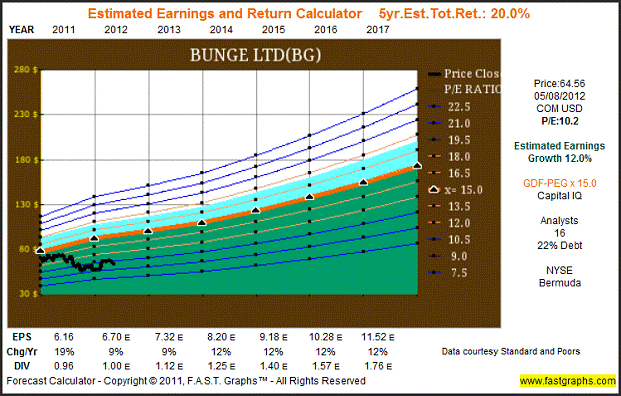
The consensus of 16 leading analysts reporting to Capital IQ forecast Bunge Ltd’s long-term earnings growth at 12%. Bunge Ltd has low long-term debt at 22% of capital. Bunge Ltd is currently trading at a P/E of 10.2, which is below the value corridor (defined by the five orange lines) of a maximum P/E of 18. If the earnings materialize as forecast, Bunge Ltd’s True Worth™ valuation would be $172.77 at the end of 2017, which would be a 12% annual rate of return from the current price.
Summary and Conclusions
These five consumer staple companies provide a menu of selections that could satisfy conservative investors interested in dividends and growth. The opportunities range from high yield with moderate growth, to lower yields with strong above-average growth. Therefore, we suggest that within this list there are opportunities to satisfy any investor’s palette and one that could quench their thirst. As always, we recommend you conduct your own due diligence.
Disclosure: Long KFT at the time of writing.
By Fast Graphs
Disclaimer: The opinions in this document are for informational and educational purposes only and should not be construed as a recommendation to buy or sell the stocks mentioned or to solicit transactions or clients. Past performance of the companies discussed may not continue and the companies may not achieve the earnings growth as predicted. The information in this document is believed to be accurate, but under no circumstances should a person act upon the information contained within. We do not recommend that anyone act upon any investment information without first consulting an investment advisor as to the suitability of such investments for his specific situation.
© 2005-2022 http://www.MarketOracle.co.uk - The Market Oracle is a FREE Daily Financial Markets Analysis & Forecasting online publication.


