The Power of Relative Value & the Silver Market! WOW!
Commodities / Gold and Silver 2012 May 11, 2012 - 08:23 AM GMT If this does not get your attention I do not know what will. Imagine buying a $400,000 furnished condo in 2011 with the proceeds of a $6,250 investment that was made in 2003. We know someone who has actually done this by using the power of relative value. Let us explain the concept and then we will explain how the relative value may apply to other great opportunities in our markets today.
Example 1:
Year 2003
$5.00/ounce of silver. BUY 1,250 Ounces = $6,250
$400,000 Condo in Las Vegas. (Popular, rising market). AVOID Market
Year 2011
$44.00/ounce of silver (Average Sale Price). SELL 1,250 Ounces = $55,000
$55,000 Same Las Vegas Condo. BUY CONDO WITH PROCEEDS
Basically, that $6,250 worth of silver grew in value and at the same time the condo fell in price, essentially allowing the $400,000 condo to be purchased with only $6,250 of initial capital. The relative value of silver increasing to $55,000 and the condo falling in price to $55,000 created an amazing opportunity to switch capital from one asset to another. These numbers were generalized and we did not account for transaction costs, but the general concept of relative value is what is important to understand here. Imagine owning a $400,000 condo “outright”, with no mortgage, and only having paid a total of $6,250 for it eight years earlier.
Do we see some relative value opportunities today? YOU BET!
Year 2007
$46/share of Silver Standard (Silver Mining Equity). AVOID
$16/ounce of silver BUY SILVER.
$16 / $46 = 1 ounce of silver will buy 0.35 shares of Silver Standard
Year 2012
$13/share of Silver Standard. BUY SILVER STANDARD WITH PROCEEDS FROM SILVER
$30/ounce of silver. SELL initial investment in silver
$30 / $13 = 1 ounce of silver will buy 2.3 shares of Silver Standard
- It is estimated that Silver Standard owns about 1.3 Billion ounces of silver in the ground.
- In 2012 an investor could buy a 560% larger ownership of that 1.3 billion ounces of silver than they could in 2007.
- In 2012 that 1.3 billion ounces of silver is worth nearly double the value it was in 2007. At the same time Silver Standard has fallen about 72% in price.
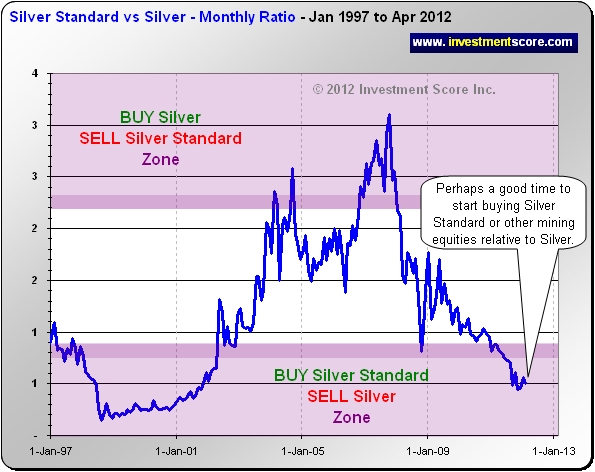
The following chart illustrates this concept in the form of a ratio.

When the blue line rises in the above chart the price of the Silver Stock is increasing in value faster than the Silver is and vise versa on the down side. This chart illustrates how a mining equity with 1.3 billion ounces of silver in the ground has been decreasing in price at a time when the product they sell was increasing. The relative value has switched significantly, but this dynamic can not last forever.
Let’s look at another great relative value opportunity:

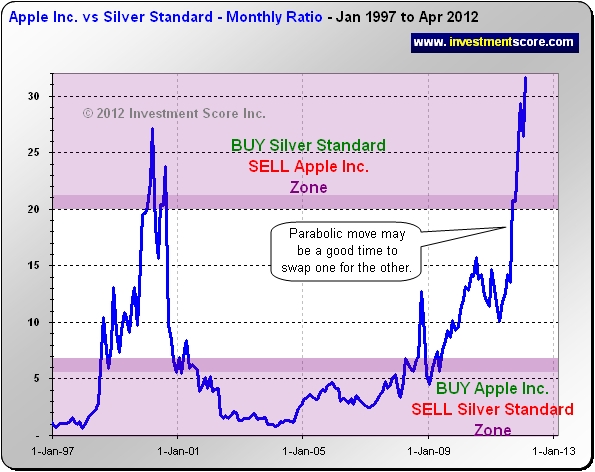
The above chart illustrates how many Silver Standard Shares an investor can buy with one Apple Inc. share. As the blue line heads up an investor in Apple Inc. could cash in some or all of their profits and buy a much larger portion of Silver Standard’s estimated 1.3 billion ounces of silver that is in the ground. It is completely possible that a company such as Silver Standard has internal or external issues that are causing the stock price to fall. The relative value concept can be applied to entire markets or to a basket of stocks in order to help reduce risk.
In our opinion this is a fantastic way to view the markets and can lead to real opportunities such as the silver versus condo example listed at the start of this article. Looking at a chart from a relative value perspective can help eliminate the distracting effects of a fluctuating currency and help provide better historical insight for market timing purposes. At www.investmentscore.com we have built proprietary indicators that incorporate relative value principles to help us monitor major market moves. We are currently investing in the silver market and if you would like to learn more about our service or to sign up for our free newsletter we suggest you visit us at www.investmentscore.com.
By Michael Kilback
Investmentscore.com
Investmentscore.com is the home of the Investment Scoring & Timing Newsletter. Through our custom built, Scoring and Timing Charts , we offer a one of a kind perspective on the markets.
Our newsletter service was founded on revolutionary insight yet simple principles. Our contrarian views help us remain focused on locating undervalued assets based on major macro market moves. Instead of comparing a single market to a continuously moving currency, we directly compare multiple major markets to one another. We expect this direct market to market comparison will help us locate the beginning and end of major bull markets and thereby capitalize on the largest, most profitable trades. We pride ourselves on cutting through the "noise" of popular opinion, media hype, investing myths, standard over used analysis tools and other distractions and try to offer a unique, clear perspective for investing.
Disclaimer: No content provided as part of the Investment Score Inc. information constitutes a recommendation that any particular security, portfolio of securities, transaction or investment strategy is suitable for any specific person. None of the information providers, including the staff of Investment Score Inc. or their affiliates will advise you personally concerning the nature, potential, value or suitability or any particular security, portfolio of securities, transaction, investment strategy or other matter. Investment Score Inc. its officers, directors, employees, affiliates, suppliers, advertisers and agents may or may not own precious metals investments at any given time. To the extent any of the content published as part of the Investment Score Inc. information may be deemed to be investment advice, such information is impersonal and not tailored to the investment needs of any specific person. Investment Score Inc. does not claim any of the information provided is complete, absolute and/or exact. Investment Score Inc. its officers, directors, employees, affiliates, suppliers, advertisers and agents are not qualified investment advisers. It is recommended investors conduct their own due diligence on any investment including seeking professional advice from a certified investment adviser before entering into any transaction. The performance data is supplied by sources believed to be reliable, that the calculations herein are made using such data, and that such calculations are not guaranteed by these sources, the information providers, or any other person or entity, and may not be complete. From time to time, reference may be made in our information materials to prior articles and opinions we have provided. These references may be selective, may reference only a portion of an article or recommendation, and are likely not to be current. As markets change continuously, previously provided information and data may not be current and should not be relied upon.
Investmentscore.com Archive |
© 2005-2022 http://www.MarketOracle.co.uk - The Market Oracle is a FREE Daily Financial Markets Analysis & Forecasting online publication.


