


Gold $12,000 and Silver $1000, 20 years from now?
Commodities / Gold and Silver 2012 May 13, 2012 - 01:49 AM GMTBy: Willem_Weytjens

 Should both Gold & Silver Bulls & Bears take a long winter sleep?
Maybe…

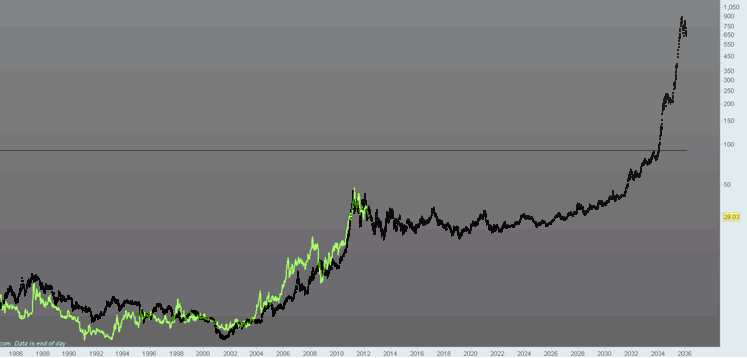
When we look at Silver prices from 1985 to today (Green line in the chart below) and compare the evolution to the one from 1967 to 1974 (black line in the chart below), we can see a very similar pattern. If price would continue to track this pattern, it could mean that silver has just entered a 20 years lasting winter sleep. In the meantime, it would trade between $20 and $50, before taking off again in 2032… From then on, it could gain over 2,000% to reach nearly $1,000.
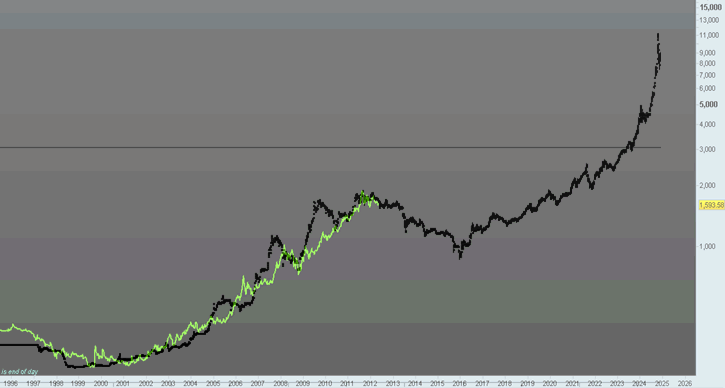
A similar pattern can be observed in the price of Gold, although the time scale is slightly different.
Gold would drop towards $1,000 in 2015, before taking off to about $12,000 by 2025.
Why the hell would Gold drop towards $1,000 per ounce by 2015, while all the fundamentals are pointing to a “screaming buy”?
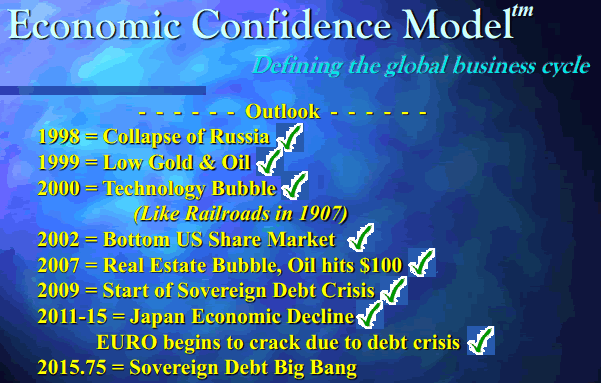
Well, if Martin Armstrong is correct and we would get a Sovereign Debt “Big Bang” sometime late 2015, then that could be the reason for Gold’s drop (please have a look at the following slide which he presented in 1998 & click HERE for the complete presentation).
Sure, Debt Crises SHOULD be good for Gold, but even though the crisis in Europe is escalating, Gold is not acting as a “safe haven”. If the Debt crisis continues until 2015 (to reach a climax late 2015) and Gold continues to act the way it does right now, we could see Gold trade as low as $1,000 per ounce again.
All of Martin Armstrong predictions in 1998 came true, so the chances are high that the last one will too.
Jim Rogers was recently quoted saying: “It’s extremely unusual for any asset in history to move higher for 11 straight years. That’s why I expect the recent correction in gold to continue.” He’s not selling any of his gold. And he’s not shorting it, either.
It would take a “gigantic new gold supply” or all the world’s central banks deciding to dump gold before he’d short. That’s because Roger’s believes the big gold bull market has “years to go.” Still, gold could drop as far as $1,100 an ounce, he said. “I would buy gold if prices fall to $1,100 or $1,200 an ounce. A pullback of this magnitude is normal.” (Read more: Stockhouse).
Back in 2008 when Gold was trading around $900 (after having traded above $1,000 for the first time in history), he said in an interview with the Chinapost he would buy Gold if it were to drop towards $750. Eventually, it bottomed 10% lower around $680, before nearly trippling over the next 3 years.
Assume Rogers is right, and Gold drops towards $1,100 (the point where he would add to his positions), and history repeats (meaning Gold bottoms about 10% lower), that would put Gold at $1,000 an ounce, which is also the price target of the second chart above.
Now why should Gold & Silver take a break?
First of all, as mr. Rogers says: Gold has gone up for 11-12 years in a row, which is exceptional. One down-year means nothing as long as the Bull market is intact.
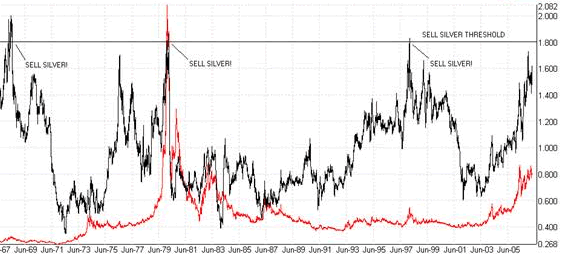
Another reason would be the fact that Silver outperformed Gold by a factor of nearly 2x over a 4 years rolling basis in April 2011. Please read THIS ARTICLE, where we discussed the following chart (created by Roland Watson):
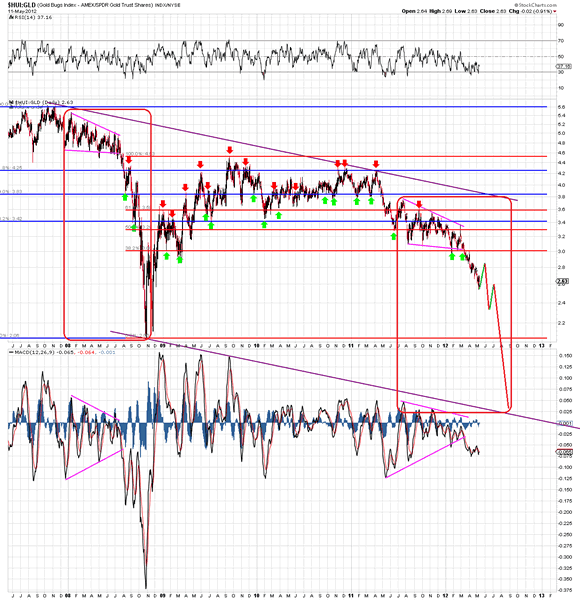
Now let’s have a look at the markets. I have written extensively about how the HUI index has been under performing Gold, just like in 2008. The pattern is still holding so far, which does not look good at all:
However, sentiment in Gold Stocks is VERY depressed at the moment, as only 10% of the Gold stocks have a BUY signal on the Poing & Figure chart, as shown in the following chart ($BPGDM). On top of that, the HUI index has now hit the 50% Fibonacci Retracement level from the bottom in 2008 to the top in 2011:
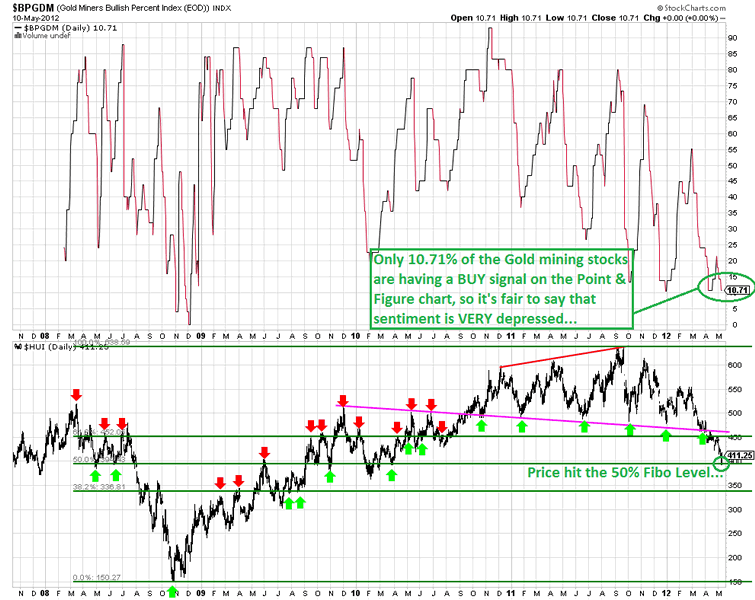
Gold stocks are trading at historical low valuations compared to Gold, so this combined with the extremely depressed sentiment could mean that Gold Stocks are at or near a bottom, although the similarities with the 2008 crash are still striking and therefore worrisome.
I haven’t bought Gold stocks since I sold them in 2011, right before Silver hit nearly $50 per ounce, but am now back in the market.
To find out which stocks I Buy & Sell, feel free to sign up for my services.
I have decided to only accept new subscribers until June 30th. From then on my services will be open to existing subscribers ONLY. To secure your membership now, visit www.profitimes.com and subscribe now!
Willem Weytjens
www.profitimes.com
© 2012 Copyright Willem Weytjens - All Rights Reserved
Disclaimer: The above is a matter of opinion provided for general information purposes only and is not intended as investment advice. Information and analysis above are derived from sources and utilising methods believed to be reliable, but we cannot accept responsibility for any losses you may incur as a result of this analysis. Individuals should consult with their personal financial advisors.
© 2005-2022 http://www.MarketOracle.co.uk - The Market Oracle is a FREE Daily Financial Markets Analysis & Forecasting online publication.