


Stock, Forex and Commodity Markets Analysis and Trading Charts Setups
Stock-Markets / Financial Markets 2012 May 21, 2012 - 12:36 PM GMTBy: Capital3X

 We have been having a superlative run in May. But we have little time to gloat over what we did in the last 10 days. Time to look at some weekly charts as Asia opening draws closer. The verdict is at the end of the post but dare you not read through all my charts before reading the conclusion. I have spent hours on a sunday late night to pick setups for you. So please give me an audience and read it.
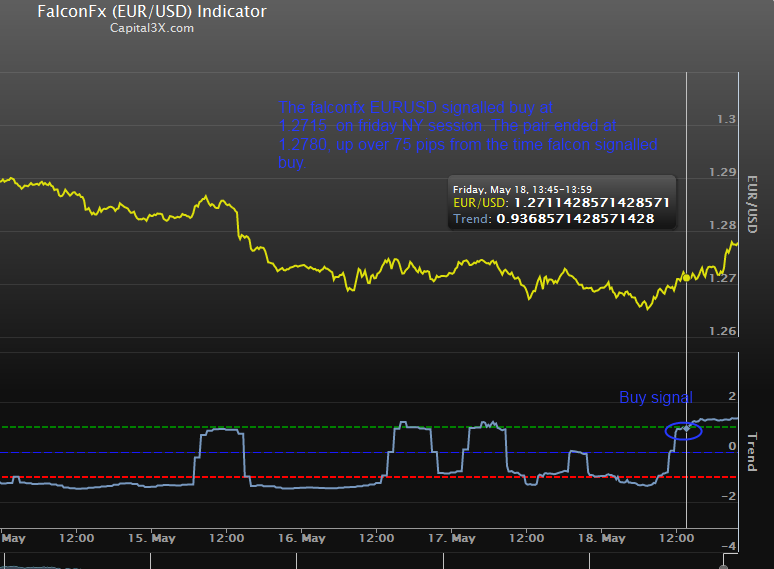
Falconfx EURUSD has been strongly positive on the hourly since 1.2717. The pair closed at 1.2780. As charts below will tell you of the story the pair is spinning.
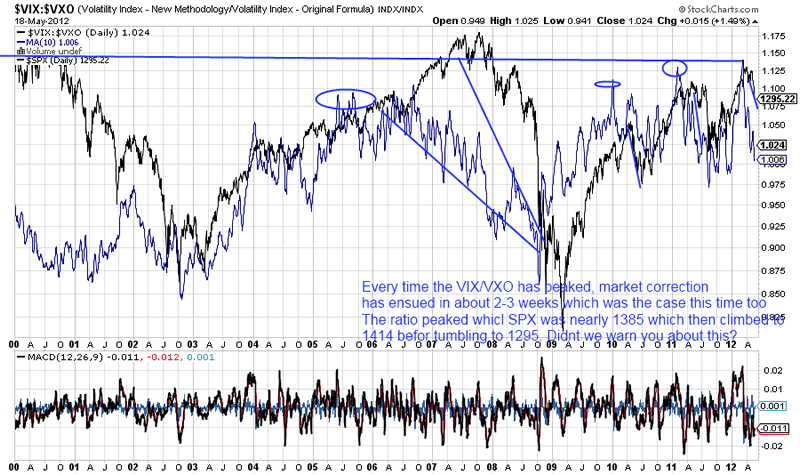
The VIX/VXO ratio was at decade highs when I noted its important relation ship on how it is predicting a major correction for the markets in about 2-3 weeks. The market correction begins well after the ratio peaks. Sure the ratio touched a peak while SPX was at 1380 levels.
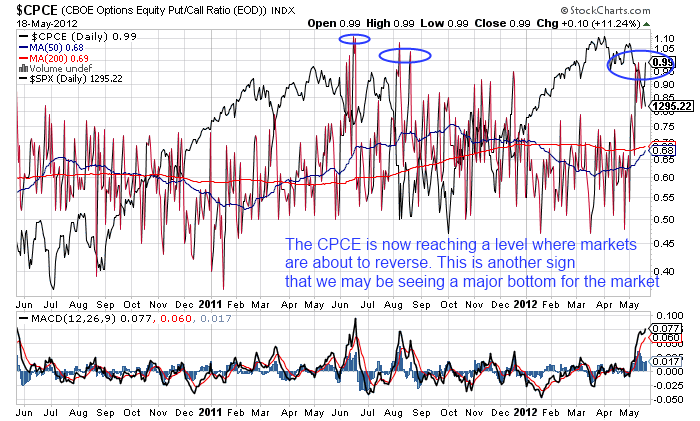
The put call ratio takes a peak at 0.99. We know when this ratio peaks, markets tend to put in a bottom. Why? The answer is simple as retails starts buying more puts which are being eagerly written down by banks, markets will once again make the retail hold the bag while the banks run with their loot. In fact what we saw last week was fear being pushed down retail throat while markets look to be bottoming.
Forex Setups
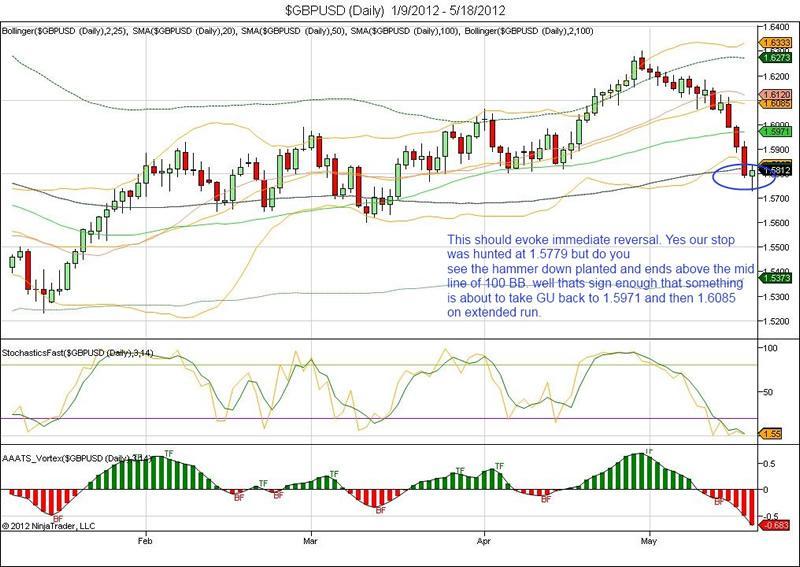
I did had a setup on this last week with a long at 1.58 and a stop at 1.5779. Now that is tight trade but even then logic behind the trade is still standing. Watch the hammer at 1.5730 as the pair fights back above the mid 100 BB at 1.58 and closes at 1.5812. That is bullish!
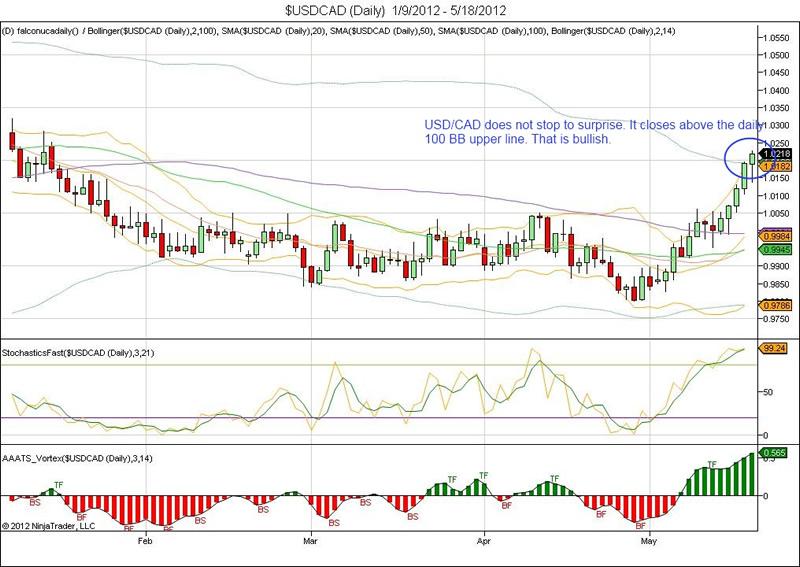
USD/CAD stands at the upper BB line of 100 D BB at 1.0222. Now unless CAD wants to defy what we see on the dollar charts, we should see technical weakness on USD/CAD going into the week.
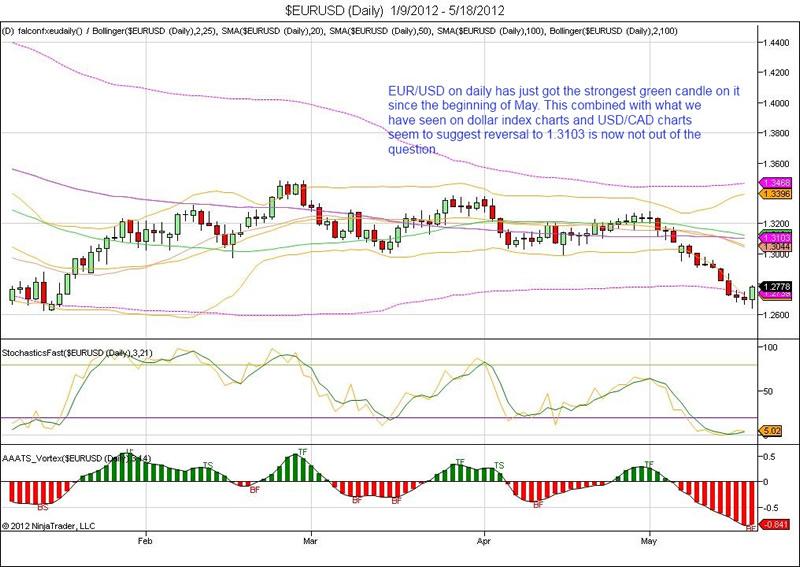
The EURUSD on the daily has just got its strongest green candle for the month of May. Do not ignore this as we see confirmation on dollar index charts and the USDCAD charts.
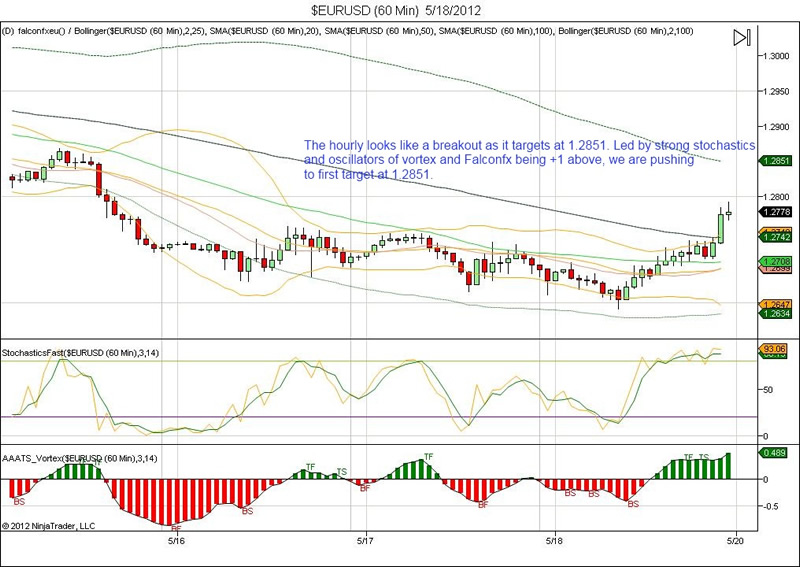
On the hourly, we see clean breakout with Falconfx EU very strongly positive as shown above.
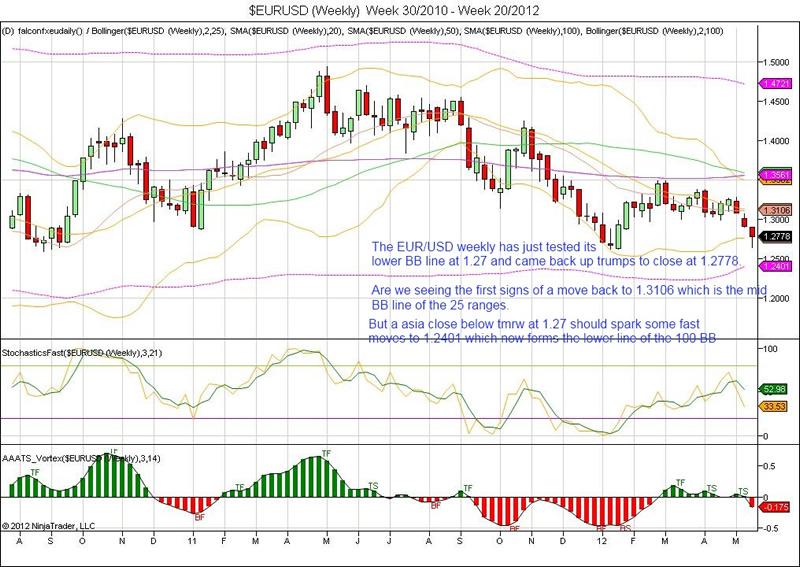
On the weekly, EUR/USD has tested its weekly support at lower 25 BB line at 1.270. On the weekly charts the stops have to be well and truly below 1.27 aiming for 1.310 levels.
ES(SPX Emini futures) Setup
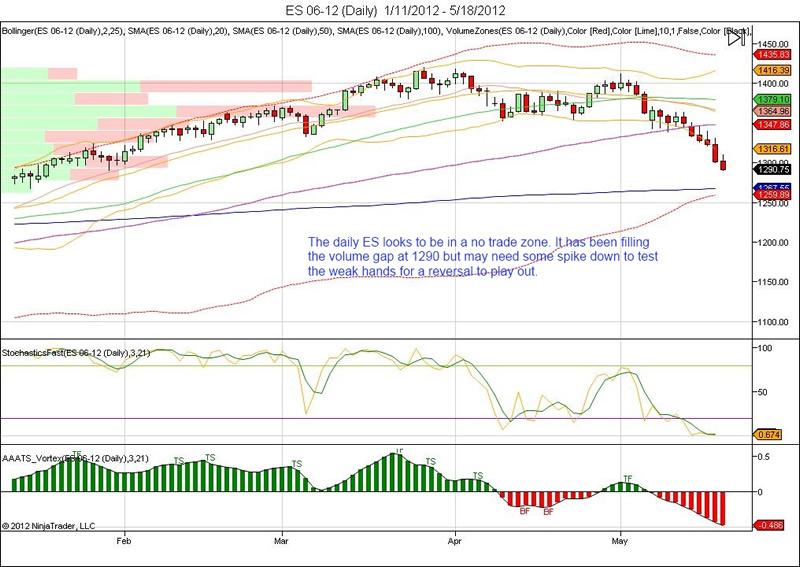
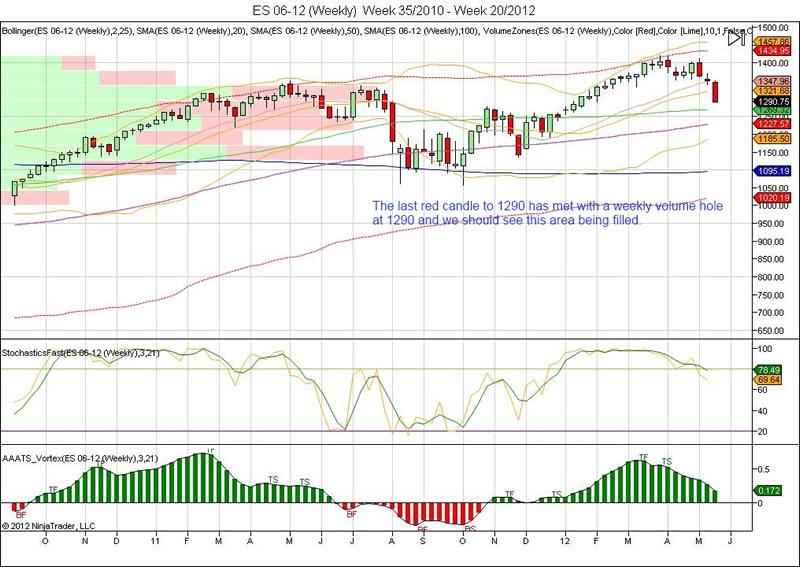
The weekly chart volume hole at 1290 is being filled but further falls looks entirely likely but somehow given the contradicting signals from other markets, we would like to long ES above 1321 for a move to 1347.
Commodity Setups
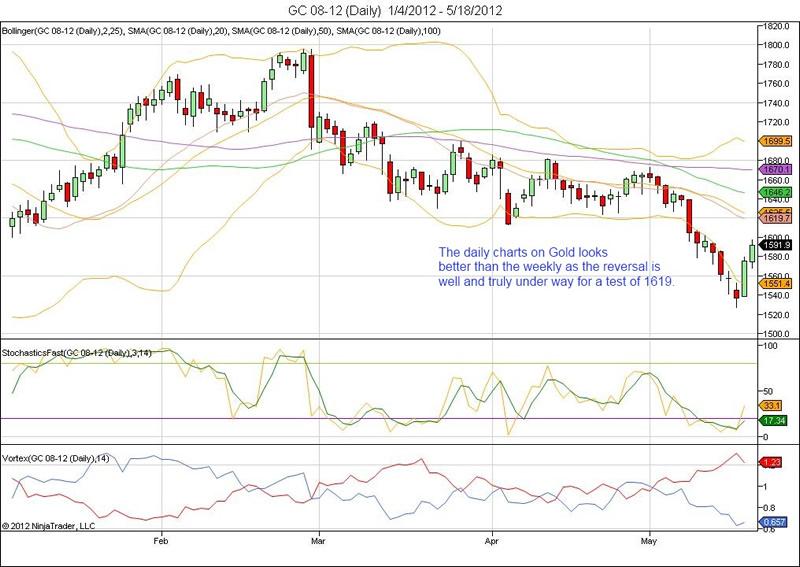
The Gold daily chart looks better than the weekly which still needs a few days of upward draft. The daily is aiming for 1619 level but we will wait for some testing of 1570 levels to get in on this one.
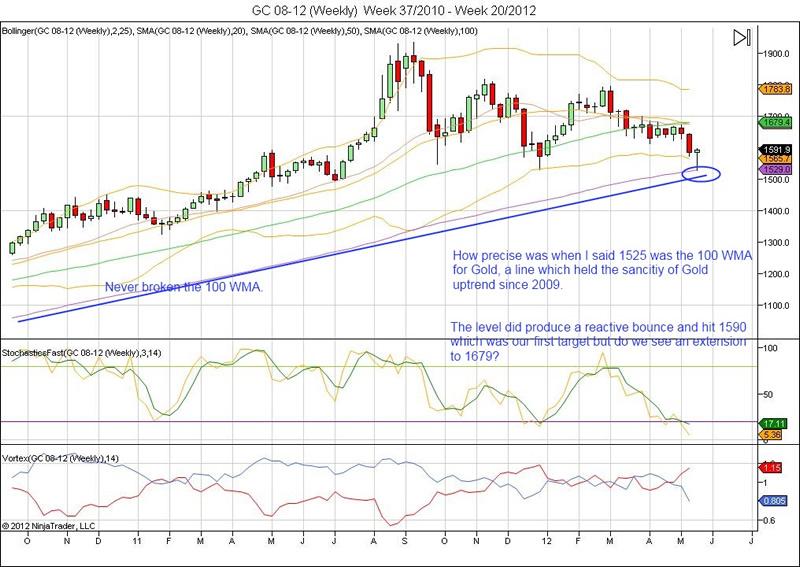
The weekly prices tested the 100 WMA at 1525 before rebounding to 1591. Read our last week updates and see what we said? 1525 was the 100 WMA, a line untouched since 24 months. This line guards the sanctity of Gold uptrend.
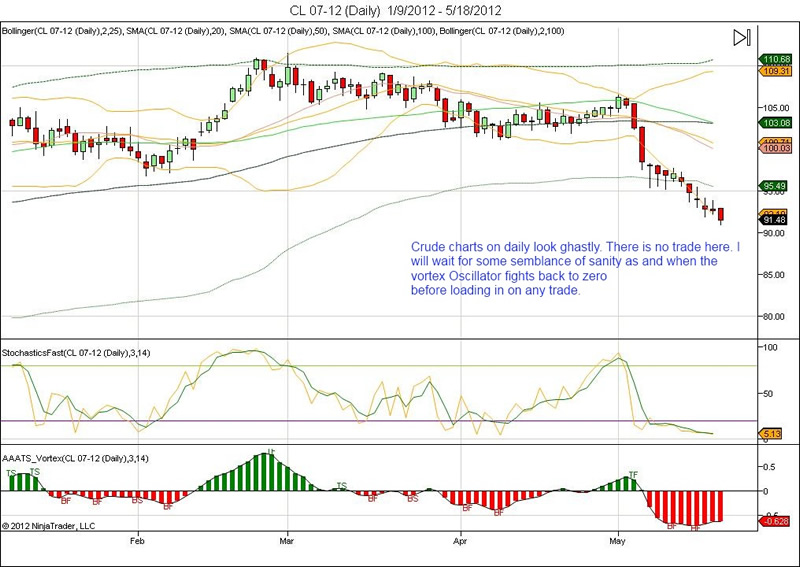
Oil charts on daily need some serious retrace before we can load any trade on them. The damage has been
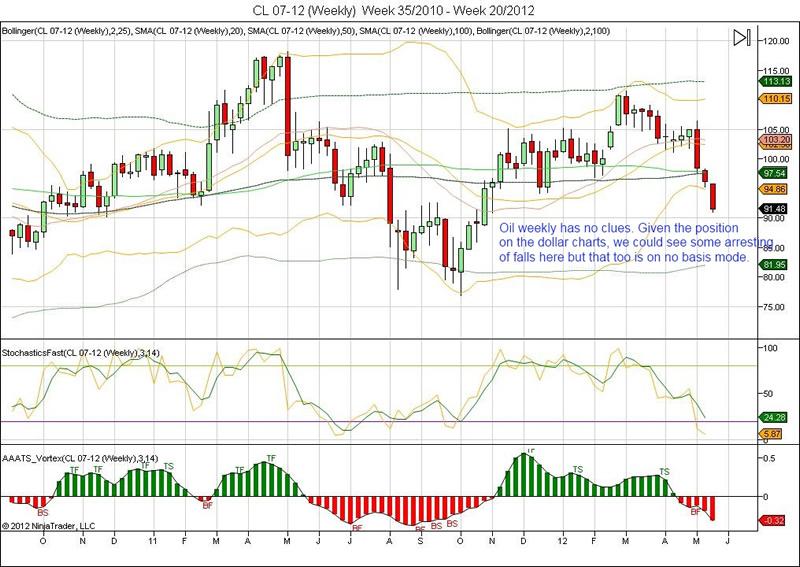
The Oil charts on weekly are abysmal the least to speak. It has broken through 97.54 levels but given that was the previous breakdown level, we may want to see a test of that level again.
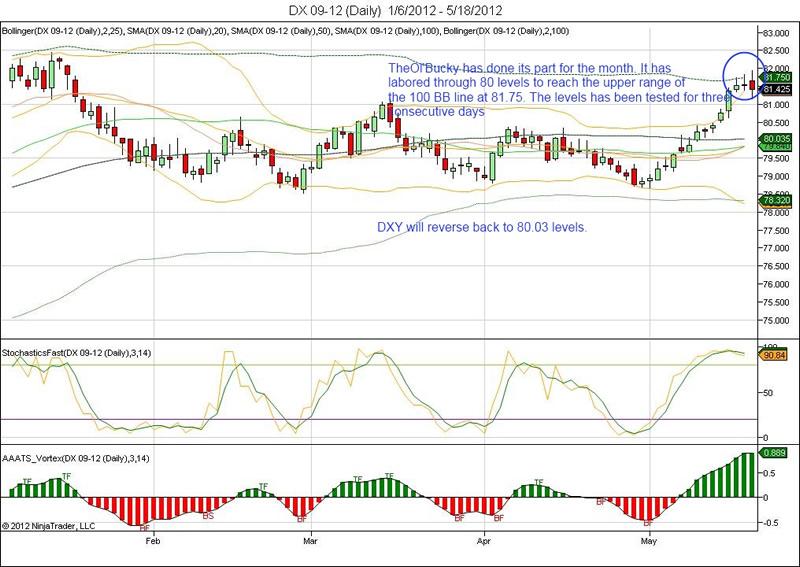
The dollar index is at critical levels here. A picture is worth a 1000 words. How well does this level at 81.75 sum the situation in the market and my bias at that. 81.75 forms the third consecutive daily test level and yet the line has not given way. Whats more is that the line forms the upper range of 100 BB line. This has the potential to push dollar down back to 80.03 levels.
quite severe.
Bond Setups
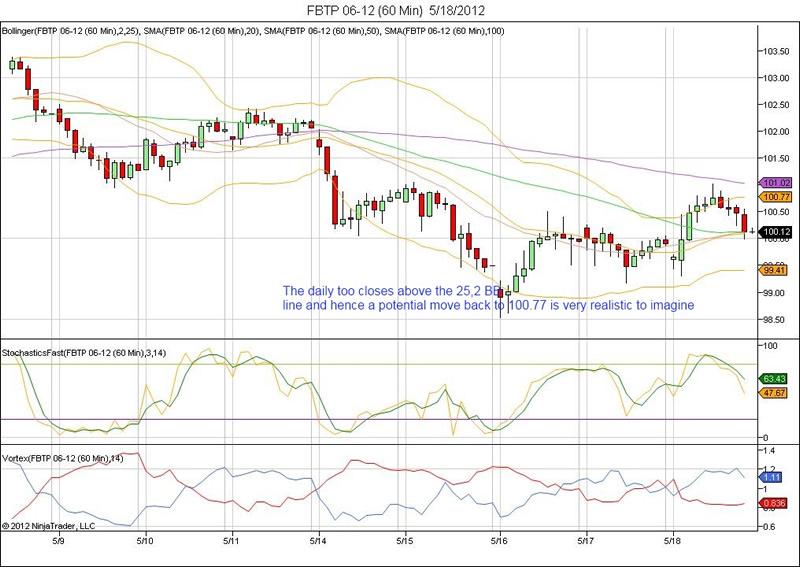
The daily charts are closing above the 100.12 level which is the mid of 25,2 BB line. We should see some reversal back to 100.77
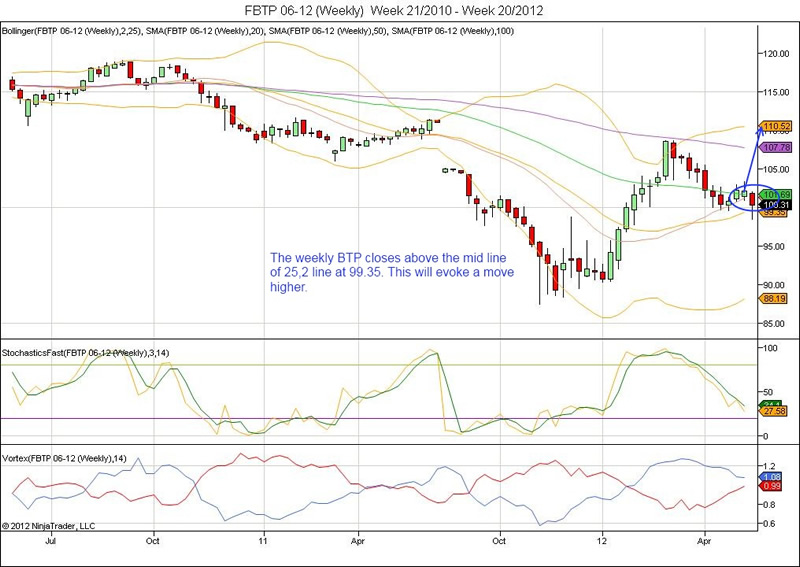
The Italian 10 year weekly closes above the weekly 25,2 BB mid line at 99.35 which should evoke a move higher and hence also pull the EU upwards.
Verdict: Things on risk assets are tending to bottom out while there are still few contradicting signals but they have reduced in number from Thursday when I was completely confused which is why trading was light on Friday. Now that we have some confirmation courtesy Dollar Index, EUR/USD, Falconfx, USD/CAD, there is some level of confidence that we may see some kind of reversal in short term but even then we need to wait for couple of sessions or three to ascertain if things stand as I wrote above.
- The May Live Trade Sheet
- The May Live Trade Room
- C3X Performance FX portfolio
- The Bond auction schedule can be found here: Bond schedule
- The speaker schedule can be found here: Speaker schedule
The Indicator links are provided here:
1. Falconfx EUR/USD
2. Falconfx EUR/JPY
3. Falconfx USD/CAD
4. Gladiator ES
All Indicator subs get access to the Live Trade room. Please do visit the The Cheat Sheet for Indicators:http://capital3x.com/the-code/cheat-sheet-gladiator-and-falcon/
If you are not a member with us: There are two levels of membership
- Capital3x membership which comes with all the benefits of Capital3x FX portfolio and premium analysis.
- Capital3x Membership with MNI news bulletsThere is a combined package where you can get both Capital3x and MNI forex real time news bullets. You can explore membership to that via this link:
Kate Capital3x.com Kate, trading experience with PIMCO, now manage capital3x.com. Check performance before you subscribe.
© 2012 Copyright Capital3X - All Rights Reserved
Disclaimer: The above is a matter of opinion provided for general information purposes only and is not intended as investment advice. Information and analysis above are derived from sources and utilising methods believed to be reliable, but we cannot accept responsibility for any losses you may incur as a result of this analysis. Individuals should consult with their personal financial advisors.
© 2005-2022 http://www.MarketOracle.co.uk - The Market Oracle is a FREE Daily Financial Markets Analysis & Forecasting online publication.