


U.S. Housing Market Is Stabilizing
Housing-Market / US Housing May 23, 2012 - 01:40 AM GMTBy: Asha_Bangalore

 Sales of existing homes rose 4.6% in April to annualized rate of 3.4 million units, following decline in February and March. Purchases of single-family existing homes rose 3.0% to an annual rate of 4.09 million units. The April sales tally of existing homes is the best in the entire recovery excluding the spikes recorded when the first-time home buyer credit program was underway and sales readings of January 2012. On a 3-month moving average basis, sales of existing single-family homes have been essentially flat.
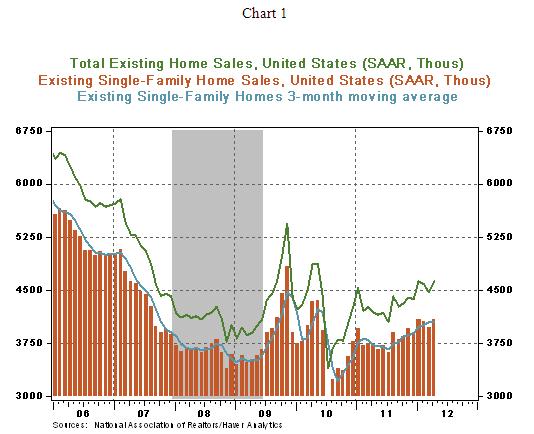
Sales of existing homes increased in all regions of the nations, with the Northeast (+5.1%), West (+4.4%), and South (+3.5%) recording the relatively larger gains compared and Midwest (+1.0%).
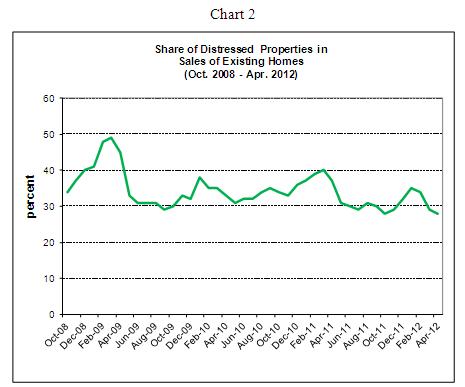
Distressed properties (foreclosed and short sales) made up 28% of existing home sales in April, the lowest percentage since October 2008, with the exception of a similar reading in October 2011 (see Chart 2). According to the National Association of Realtors, foreclosures accounted for 17% and the remaining 11% was short sales. Distressed homes made up 29% of sales in March 2012 and 37% in April 2011. The gradual reduction of distressed properties as a share of total sales of existing homes is an important improvement in the housing sector.
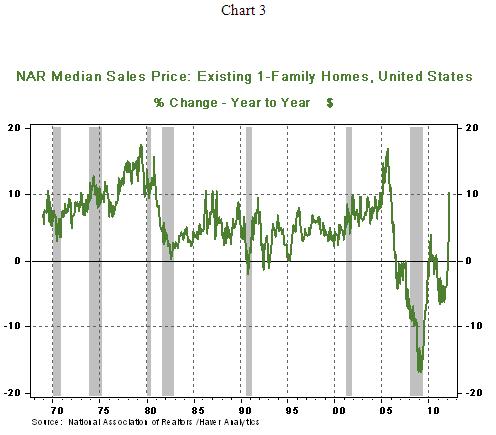
The median price of an existing single-family home at $178,000 rose 10.8% from a year ago, a significant jump. This sharp increase appears to be a one-off event, with more moderate price gains likely in the months ahead.
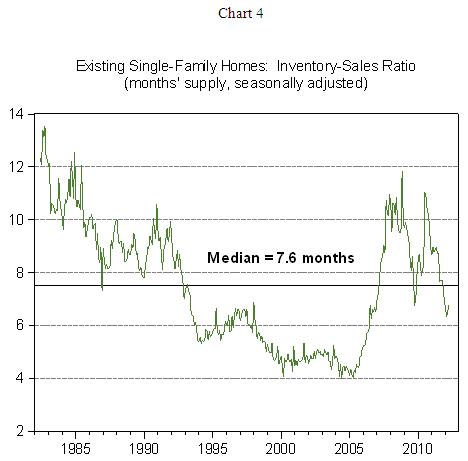
The in-house seasonally adjusted inventory of single-family homes moved up slightly to 6.6-month supply from 6.3-month supply in March. The fact that the latest inventory-sales ratio has held below the historical median of 7.6 months since November 2011 is another piece of evidence that the housing market indicators are showing a notable improvement (see Chart 4).
In sum, the April existing home sales reports has many positives. The level of sales is stabilizing, the inventory of unsold existing homes is not severely burdensome, and the share of distressed properties is trending down, albeit gradually. Although the magnitude of the gain in the median price of an existing home is not the beginning of a long-lasting trend, the upward trajectory of home prices is consistent with other indicators of the housing market.
Asha Bangalore — Senior Vice President and Economisthttp://www.northerntrust.com
Asha Bangalore is Vice President and Economist at The Northern Trust Company, Chicago. Prior to joining the bank in 1994, she was Consultant to savings and loan institutions and commercial banks at Financial & Economic Strategies Corporation, Chicago.
Copyright © 2012 Asha Bangalore
The opinions expressed herein are those of the author and do not necessarily represent the views of The Northern Trust Company. The Northern Trust Company does not warrant the accuracy or completeness of information contained herein, such information is subject to change and is not intended to influence your investment decisions.
© 2005-2022 http://www.MarketOracle.co.uk - The Market Oracle is a FREE Daily Financial Markets Analysis & Forecasting online publication.