German Economic Locomotive Being Dragged Down, Euro's Cyclical Path
Currencies / Euro May 24, 2012 - 12:42 PM GMTBy: Ashraf_Laidi
 More evidence of the German locomotive dragged down by the rest of the European continent as German manufacturing PMI dips to 45.0, its lowest figure since May 2009. The French version of manufacturing PMI hit 44, also a 36-month low. EURUSD hits a fresh low on the year at $1.25, down 3.3% year-to-date, and down 7.0% from its February highs. Our warning that the PMIs were a more effective leading indicator than the IFO or ZEW was first made in March, stating the reasons in more detail.
As long as major central banks refrain from any new liquidity action in the form of FX swaps (as in Dec 2nd) and the IMF remains silent before the Greece June 17 elections, the path of least resistance for traders to continue selling the euro rallies and eventually targeting the 2010 lows under $1.18.
Euro's Cyclical Path
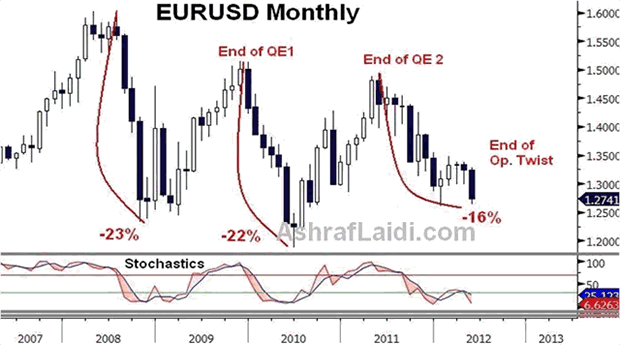
We first charted the euros cyclical paths back in November on here outlining that a retest of the $1.20 is inevitable. In order for EURUSD to reproduce the 22% declines in the prior two cycles of 2008 and 2010, the pair would have to reach $1.17-1.16, which would be the lowest since 2003. As long as major central banks refrain from giving any new liquidity in the form of FX swaps (as in Dec 2nd) and the IMF remains silent before the Greece June 17 elections, the path of least resistance for traders to continue selling the rallies. The 1.20 is becoming increasingly a matter of when rather than if.

Fundamental catalysts for further EURUSD downside may include:
-
mismanaging a Greek exit;
-
lack of resolution and deadlock between Athens & Troika without necessarily a Greek exit;
-
unsuccessful interventions from global central banks (coordinated FX swaps, LTRO-3, BoE QE-4 and more BoJ easing)
-
the Feds reluctance to issue a 2nd round of outright QE. Operation Twist is not deemed a sufficient generation of liquidity and a booster of risk-on trades if on its own.
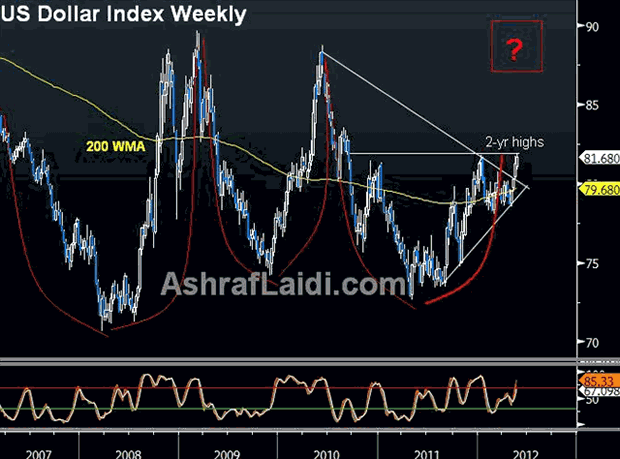
Broadening the USD view into the US dollar index, we find that the USDX is testing levels not seen since September 2010. The importance of the USDX is highlighted in its use by macro hedge funds and Commodity Trade Advisers (small size hedge funds). As the index takes out the January high of 81.78 and hits a new 2-year high of 82.36, it risks extending algos orders and the execution of stop orders cascading the ascent into 82.40 (61.8% retracement of the decline from the 2010 high to the 2011 low), followed by 83.50.

As the cyclical waves over the last 5 years may suggest, a recurrence of 87 and beyond cannot be ruled out for later this year. The fundamental catalysts for such dynamics are listed above. On the downside, USDX support rests on its 200-week moving average, coinciding with the trendline support extending from the August 2011 lows.
Broadening these analysis into our Intermarket view, US crude would likely pursue the path towards $78.00-$80.00 per barrel, Brent crude would extend losses towards $94.00 per barrel and gold risks recalling the $1470s.
Get your free 1-week trial to our Premium Intermarket Insightson FX, commodities & equity indices
For more frequent FX & Commodity calls & analysis, follow me on Twitter Twitter.com/alaidi
By Ashraf Laidi
AshrafLaidi.com
Ashraf Laidi CEO of Intermarket Strategy and is the author of "Currency Trading and Intermarket Analysis: How to Profit from the Shifting Currents in Global Markets" Wiley Trading.
This publication is intended to be used for information purposes only and does not constitute investment advice.
Copyright © 2012 Ashraf Laidi
Ashraf Laidi Archive |
© 2005-2022 http://www.MarketOracle.co.uk - The Market Oracle is a FREE Daily Financial Markets Analysis & Forecasting online publication.


