


Will the ECB and Fed Follow Where China Leads?
Interest-Rates / Global Economy Jun 04, 2012 - 06:21 PM GMTBy: Frank_Holmes

 Every month, policymakers track purchasing managers' indices (PMI) around the world as they consider fiscal and monetary actions. To us, a PMI is a measure of health of companies around the world, because it includes output, new orders, employment and prices across manufacturing, construction, retail and service sectors.
Today, the J.P. Morgan Global PMI for May came in lower at 50.6--just above the level indicating expansion--and China's HSBC Manufacturing PMI fell to 48.4. Both numbers were below their respective three-month moving averages. Historically, we've seen China's PMI number leading the year-over-year change in exports by three to four months, so when the PMI has increased, a few months later, Chinese exports have historically risen, and vice versa.
China's HSBC PMI tends to be more reflective of export demand, as it is compiled by private parties, covers a smaller survey sample and is weighted toward smaller businesses. Therefore, a lower PMI number indicates lower export demand.
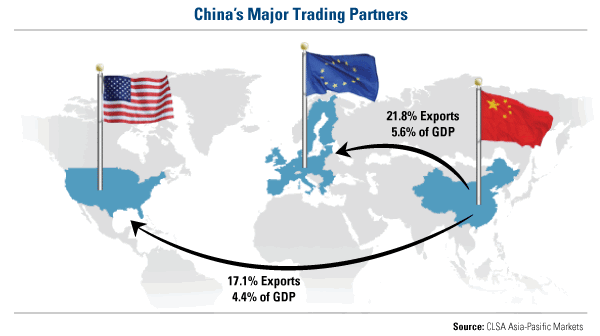
With Europe's growth in a deep freeze, China is feeling the pain. While many think the U.S. is receiving most of the Chinese-made goods, Europe is actually China's largest export partner. Nearly 22 percent of China's exports head to Europe, contributing nearly 6 percent to China's GDP; only 17 percent of exports from China are shipped to the U.S.
With fewer exports to Europe, China's GDP growth could be affected, but probably much less than one might think. Listeners of our webcast a few months ago heard Andy Rothman from CLSA explain how China has become less dependent on the world for its growth. As you can see from the chart below, CLSA had already assumed net exports of goods and services out of China to be negative this year because of slower growth from Europe and the U.S.
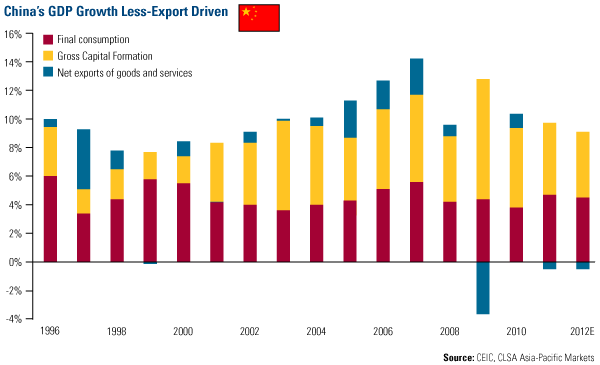
Yet, China clearly has the upper hand in controlling growth. Take a look at what happened in 2009 when exports declined dramatically: The government stepped in with a massive stimulus package devoted to bank lending and infrastructure construction. This effort significantly boosted overall GDP growth and "pushed the Chinese economy out of a deep slump," says research firm BCA Research.
Despite net exports falling about 4 percent in 2009, GDP actually grew more than 12 percent.
China won't put the pedal to the metal like it did in 2009, though. Premier Wen Jiabao recently said that the government "should continue to implement a proactive fiscal policy and a prudent monetary policy, while giving more priority to maintaining growth," according to Bloomberg News. China is more like Goldilocks: The government wants the economy to be not-too-hot or not-too-cold.
The important thing to remember is that the government will want to avoid the expansion that was "associated with the earlier plan that led to higher CPI, asset price inflation and a surge in lending to non-priority projects," says J.P. Morgan. Rather, the focus is on making sure the country shifts to a "more sustainable trajectory of growth," says the research firm.
With the renewed eurocrisis, "Chinese authorities are currently facing an extremely complex and unpredictable situation," says BCA. They'll continue to monitor the situation and not make any drastic moves; rather, "Chinese authorities will stay on high alert and act promptly to rescue growth in case of external shocks," says BCA.
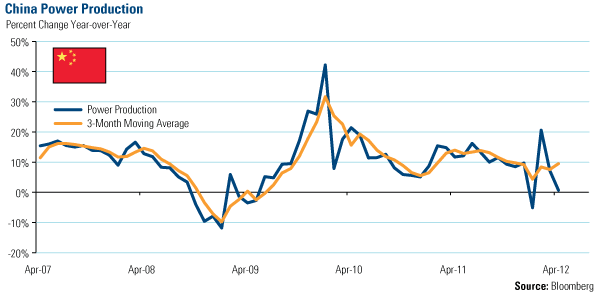
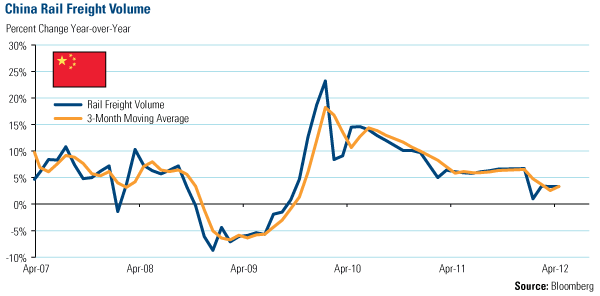
So what will they be tracking as they monitor the situation? We've heard the new Chinese Premier-to-be Li Keqiang is paying attention to three factors: power production, railroad freight volume and new bank loans.
Power production in April was slightly positive on a year-over-year basis, but still remained weak.
On May 31, railroad freight volume was released for April, and showed an increase of 3.3 percent over last year, the same reading as March.
New bank loans are down 7.8 percent year-over-year as of May 11, which we believe was the primary reason that China cut the required reserve ratio (RRR) on May 12. J.P. Morgan agrees, saying that together with the RRR cuts, "the seeming start of a new cycle of public spending and consumer stimulus should help to boost loan demand in the economy."
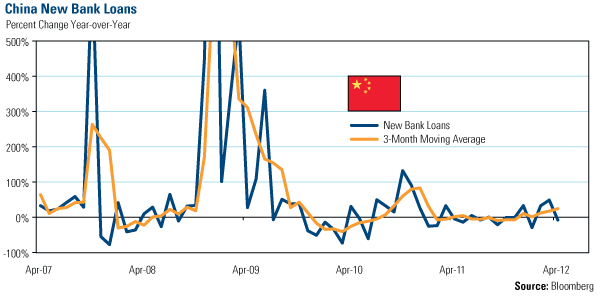
Looking at the five year data above, all factors are near their lows and below their 3-month moving averages. In whatever shape or form, we expect policy easing to continue.
What appears to be overlooked by the mountain of negative economic news is the fact that China's stock market is outperforming. In May, the A shares were the best-performing equities among all the developed and emerging stock markets we track. For the year, China's investors still hold onto a gain of 7 percent, putting the country among the top half of the emerging markets and above all developed markets. This bifurcation may be signaling that the worst is behind us.
Keep in mind that negative news in the media may be a danger sign to some people; to Chinese policymakers, it's a signal to act.
We believe the next government policy cycle might be just around the corner. In fact, we've already seen indications of stimulus from China, such as giving the "green" light to car buyers. Perhaps the European Central Bank and the Federal Reserve will follow suit to avoid a repeat of the last few summers.
This is only a few of the points I discussed at the Cambridge House's World Resource Investment Conference in Vancouver. I hope to post my presentation on www.usfunds.com in a few days.
For more updates on global investing from Frank and the rest of the U.S. Global Investors team, follow us on Twitter at www.twitter.com/USFunds or like us on Facebook at www.facebook.com/USFunds. You can also watch exclusive videos on what our research overseas has turned up on our YouTube channel at www.youtube.com/USFunds.
By Frank Holmes
CEO and Chief Investment Officer
U.S. Global Investors
U.S. Global Investors, Inc. is an investment management firm specializing in gold, natural resources, emerging markets and global infrastructure opportunities around the world. The company, headquartered in San Antonio, Texas, manages 13 no-load mutual funds in the U.S. Global Investors fund family, as well as funds for international clients.
All opinions expressed and data provided are subject to change without notice. Some of these opinions may not be appropriate to every investor.
Standard deviation is a measure of the dispersion of a set of data from its mean. The more spread apart the data, the higher the deviation. Standard deviation is also known as historical volatility. All opinions expressed and data provided are subject to change without notice. Some of these opinions may not be appropriate to every investor. The S&P 500 Stock Index is a widely recognized capitalization-weighted index of 500 common stock prices in U.S. companies. The NYSE Arca Gold BUGS (Basket of Unhedged Gold Stocks) Index (HUI) is a modified equal dollar weighted index of companies involved in gold mining. The HUI Index was designed to provide significant exposure to near term movements in gold prices by including companies that do not hedge their gold production beyond 1.5 years. The MSCI Emerging Markets Index is a free float-adjusted market capitalization index that is designed to measure equity market performance in the global emerging markets. The U.S. Trade Weighted Dollar Index provides a general indication of the international value of the U.S. dollar.
Frank Holmes Archive |
© 2005-2022 http://www.MarketOracle.co.uk - The Market Oracle is a FREE Daily Financial Markets Analysis & Forecasting online publication.