


Learning to Trade Currencies Using Multiple Time Frame Analysis
InvestorEducation / Forex Trading Jun 11, 2012 - 08:00 AM GMTBy: Submissions

 Adam Green writes:What is multiple time frame trade analysis? This is the practice of using multiple time frames to determine the trend of a currency asset so as to determine the possible points of trade entry in tandem with the direction of the trend. This trade investment strategy was designed to solve the problem of traders getting into trades that are against the trend as a result of conducting analysis only on short term time charts.
It is conventional practice to use three time frames when performing multiple time frame analysis. These time frames are the 15 minute, hourly and 4-hourly charts, although some authorities may replace the 4hourly chart with the daily time chart, which is generally regarded as the standard chart for trend determination.
The principle behind the use of multiple time frame trade analysis is to use the longest time frame chart to determine the trend of the currency asset, use the medium term chart to pick an area where the price action of the currency asset corresponds with the trend of the long term chart, and then use the short term chart to search for a trade setup that satisfies conditions for a trade entry when the conditions for the hourly and daily chart setups are in tandem with each other.
With these points in mind, let us use an example to analyse how to perform a multiple time frame analysis.
Step 1
In this example, we shall be conducting a multiple time frame analysis for gold/USD. Many brokers now offer Gold/USD (XAU/USD) as a standard traded instrument, so whatever is discussed here will also work for any other currency pair traded. The first step involves analysis of the long-term chart to determine the trend. If we look at the daily chart below, it shows that gold/USD has been in a clear downtrend.
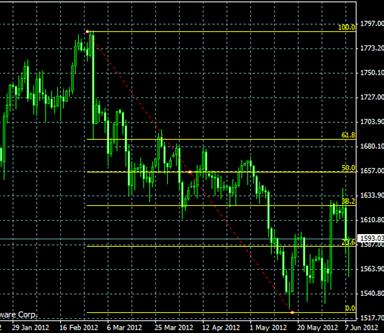
Daily chart (XAU/USD)
Step 2
Here, we look at the price behaviour in the hourly chart, which should mirror the trend on the long term chart. On this chart, we are looking for a region where the price action of traders mirrors what is about to occur in the market. We see this on the right hand side of the chart below as the price action has changed from a retracement rally to a period of consolidation, which signifies that those traders driving a retracement rally have stepped out of their positions.
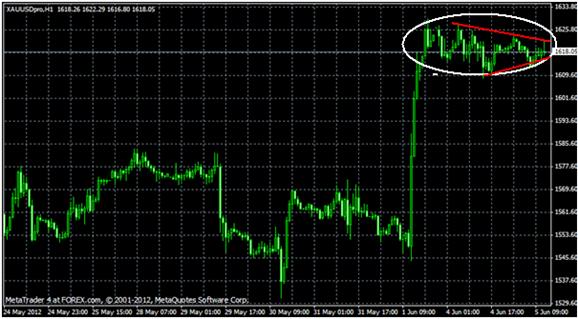
In this hourly chart, we see an area of consolidation which followed the area of price rally. This price rally is actually the retracement from the downtrend we see on the daily chart. Notice within this area of consolidation that a symmetrical triangle has formed, which shows that the price action can go either way. But given that the predominant trend for gold at this time is a downtrend, and that the retracement has stalled at the 38.2% Fibonacci retracement point, THE BIAS FOR THIS TRADE IS TO GO SHORT.
Step 3
In this step, we look to our trade execution chart, the 15 minute chart. Our sole purpose on this chart is to look for possible areas where we can confidently pull the trigger on a short trade. One way to determine this is to look for a bearish candlestick pattern, and we eventually got this as seen below:
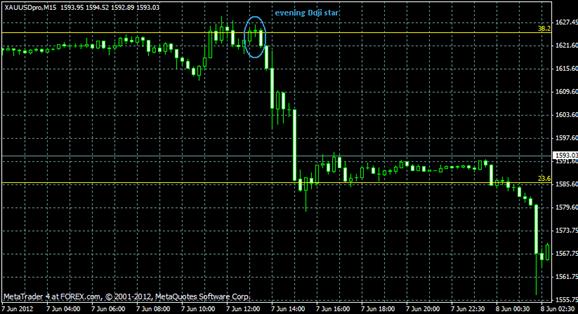
15 minute chart (XAU/USD)
We can see an evening Doji star formation which is a clear bearish confirmation. The move eventually went in a short direction by almost 4,000 pips.
This trade analysis goes to show the importance of multiple time frame analysis in financial trading. To recap this lesson:
- Use the daily chart to determine the trend of the currency. Apply the Fibonacci retracement tool from the highest candlestick point to the lowest candlestick point on the chart.
- Next, crossover to the hourly chart to see if a region has emerged where the price action corresponds to the trend on the daily chart.
- Look at the 15 minute chart to see areas at which you can execute the trade once the conditions on the daily and hourly charts are in agreement.
You cannot go wrong with multiple time frame trade analysis.
About the Author
This article was provided by Adam Green who runs www.BinaryOptions.net and has over 10 years experience trading in the currency, options and spread betting markets.
© 2012 Copyright Adam Green- All Rights Reserved
Disclaimer: The above is a matter of opinion provided for general information purposes only and is not intended as investment advice. Information and analysis above are derived from sources and utilising methods believed to be reliable, but we cannot accept responsibility for any losses you may incur as a result of this analysis. Individuals should consult with their personal financial advisors.
© 2005-2022 http://www.MarketOracle.co.uk - The Market Oracle is a FREE Daily Financial Markets Analysis & Forecasting online publication.