


Into the Matrix of the Stocks Earnings Curve Effect Deflation
Stock-Markets / Corporate Earnings Jul 08, 2012 - 04:47 PM GMTBy: John_Mauldin

 What does the current environment of earnings and valuations tell us about the prospects for the US stock markets in general over the next 3-5-7-10 years? This week we have part two of "Bull's Eye Investing Ten Years Later," which we started last week. These two letters have been co-authored with Ed Easterling of Crestmont Research. We take a look at research we did almost ten years ago as part of my book Bull's Eye Investing, updating the data and asking,"Are we there yet? When will we get to the end of the secular bear market?" We will start with a few paragraphs from last week's letter and then move right along.
High P/E, Low Returns
In Bull's Eye Investing we explained that high market valuations (P/E) necessarily drive low long-term returns. This occurs because periods that start with high P/Es often end with lower P/Es, eating away at returns. Further, high-P/E periods have low dividend yields. As a result, we could write with confidence nine years ago that subsequent returns would be well below average.
In all cases, throughout the years, the level of returns correlates very highly to the trend in the market's P/E ratio. The P/E ratio is the measure of valuation as reflected by the relationship between the prices paid per share to the earnings per share (EPS). Higher returns are associated with periods during which the P/E ratio increased and lower or negative returns resulted from periods during which the P/E ratio declined.
This may be the single most important investment insight you will get from this book. When P/E ratios are rising, the saying that a "rising tide lifts all boats" has been historically true. When P/Es are dropping, stock market investing is tricky; index investing is an experiment in futility. As we will see in later chapters, in these secular bear market periods, successful stock market investing requires a far different (and sometimes opposite) set of skills and techniques than is required in bull markets....
Given the current and recent level of P/Es, the prospects are not encouraging for general market gains (the emphasis is on general or index funds) over the next two decades. This dismal outlook is not from some congenital bear perspective; it corresponds to the series of factors driving the current secular bear market.
Although P/E has declined over the past nine years, from 26 to near 20 (using the Shiller method), stock market valuation remains relatively high. Almost everything in chapters five and six of Bull's Eye Investing remains true today. The market has chopped around with fairly typical volatility. P/E is in the lower end of the red zone rather than above it. Most importantly, currently high valuations portend low returns from here.
How low? That depends upon the outlook for deflation or higher inflation.
Our crystal balls are showing us different things on that question, although our fundamental conclusions are the same. Ed sees moderate probabilities for either higher inflation or deflation. On his optimistic side, he even allows for the prospect of continued price stability for quite some time. John, however, sees flashing danger signs of upcoming deflationary pulses, to be followed later by higher inflation. He outlined his reasoning in Endgame.
So, together, we have several scenarios. We have some side bets as to who will be right; but more importantly for you, none of the outcomes deliver good overall equity market returns, because we are still at a relatively high P/E.
By the way, neither one of us really expected inflation to stay relatively close to price stability for this long. It was clearly a possibility, but one without precedent. Yet we also knew that such historically good news would not provide good returns. The fundamentals of high valuations don't allow it.
What does the current situation tell us about the economic hazards and risk in today's stock market?
Currently, inflation is near levels of price stability. There are three potential scenarios: it can be expected to rise, to fall, or to remain constant over the next decade or two. History suggests that if inflation rises or if it falls into deflation, P/Es will fall and thus stock market returns will be disappointing, perhaps significantly so if you are expecting 9 percent compound growth in order to be able to retire in 10 years.
If inflation remains constant at near the 1 to 2 percent level for a decade, it will be unprecedented. Look at [the first chart, Secular Markets Profile] again. See if you can find a period of stable, low inflation. [Actually, don't waste your time.]
Even if inflation remained constant at current levels, the expected return from stocks over the next decade given the current P/E valuation levels would be dismal.
If history once again repeats itself, the cycles will lead to a lackluster period of a decade or two, then a period of solid and consistent gains. Oh, to be young again! The graduating classes of today will be matriculating into investment adulthood near the expected start of the next secular bull market. In the meanwhile, many will struggle with hopeful periods followed by great disappointment.
(I should note that Ed is younger than I am, but I for one do expect to be investing and writing at the beginning of the next bull cycle and have every intention of living through at least another few cycles. –John)
During these periods, the traditional sources of investment information will go on touting the next, just-about-to-break wave of hope. It will be useful to keep in mind their built-in biases. If the weather reports were being supplied by sunglasses manufacturers, would you not be wise to be skeptical?
Deflation
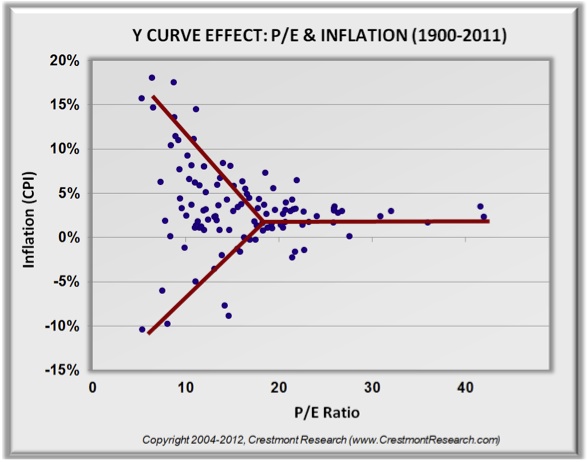
One of the key insights from Bull's Eye Investing is that both deflation and inflation are bad for stock market valuations. Both conditions have a negative effect on P/E. Past secular bear markets ended only when the run of deflation or high inflation turned back toward the low inflation of price stability. The impact of the inflation rate on P/E is highlighted in Crestmont's "Y Curve Effect."
In Bull's Eye Investing, we explained:
In the past 50 years, the financial markets have known only inflation and could hardly conceive of deflation in well managed economies. For much of that period, the Fed has sought to slay the inflation dragon – ever mindful in its monetary policy that inflation seemed to be a one-way force. Like gravity or the accelerator of a car, the laws of economic nature seemed only to know acceleration. The Fed's tool kit included techniques of restraint, brakes on inflation.
"Deflation" is a broad-based decline in general prices over time that results from a decrease in the quantity of money in relation to the available goods. It generally is known to occur when there is a general money supply contraction. Deflation can often occur following a period of excess supply or capacity beyond demand with a pervasive psychology of delayed spending or due to economy-wide debt reduction (or debt destruction). This digression onto deflation is important because the laws of financial gravity pull in an opposite direction once an economy crosses the threshold of zero….
The Fed's primary tool to reduce the spread of inflation is to reduce the supply of money, generally by making money more expensive. One way that the Fed can discourage money growth is to raise interest rates. To stimulate the economy, the Fed eases off of the brake and allows the money supply to grow. This is often accomplished by lowering interest rates to stimulate the demand for (and supply of) money. However, since investors, consumers, and business can step aside when interest rates get to zero by staying in cash, interest rates generally cannot go negative.
As a result, near the point of the inflation/deflation threshold, interest rates stop working to control money growth. Beyond lower interest rates, the impact of deflation on an economy can be debilitating. As demand slows, production declines, unemployment increases, monetary velocity decreases, and a general malaise overtakes the economy. Deflation does not need to cause a depression, though it does create a drag on the economy. As a result, earnings suffer and the future outlook is less certain with little control available to the Fed to restore the economy to a more healthy state.
Furthermore, the market does not receive the benefit of a continuously increasing P/E ratio as interest rates further decline while inflation nears zero. As the prospect of the cliff nears, valuations begin to suffer. Once the day turns to night and the deflation goblins are running amuck, P/Es start falling like a boat anchor toward levels generally reached in periods of high inflation and interest rates….
As inflation moves toward high positive or significant negative levels, P/E ratios are predominantly depressed. In other words, as prices move away from price stability (the fork in the Y), P/E ratios decline. As inflation or deflation trends back toward a condition of relative price stability, near one percent inflation, P/E ratios expand.
Again bear in mind: An environment of deflation will present very low interest rates – yet the low interest rates will not produce high P/E ratios. There will be a point as the economy is sliding into deflation that interest rates will continue falling, yet P/E ratios, as if they sense the inevitable, will begin to fall as well.
The Y Curve Effect is consistent with modern financial principles relating to stock market valuation, specifically the dividend discount model and its variations. The model asserts that the value of a stock today is equal to the price that an investor would pay to receive the future earnings and to realize a certain rate of return. As a result, the current earnings and future growth are discounted at a specified rate of return. As interest rates decline, the discount rate declines, and a higher value results.
That being said, however, in periods of deflation, future earnings may be expected to decline. Therefore, even though interest rates and discount rates are low, higher levels of deflation depress the expected future earnings. This gets discounted into the price and the result is a lower valuation and lower P/E ratio. As depicted by the scatter plot diagram [above], the Y Curve Effect does not indicate a specific level at which the impact of deflation overtakes the impact of lower interest rates on the P/E ratio. Nonetheless, this is a powerful, counter-intuitive force to consider in low interest rate and potential deflationary environments.
There weren't many analysts writing or talking about deflation back then. There were still fewer, if any, so extensively applying it to stock market valuations. Nine years later, after getting close to deflation several years ago, we are again likely to confront that risk. This time (John, especially, thinks), we may succumb to its evil force. The result will be lower P/Es and significant market declines. This would certainly cause the secular bear market to accelerate toward its end. Past secular bears did not end until P/E fell below 10. There is no reason to think that this secular bear will be any different.
Into the Matrix
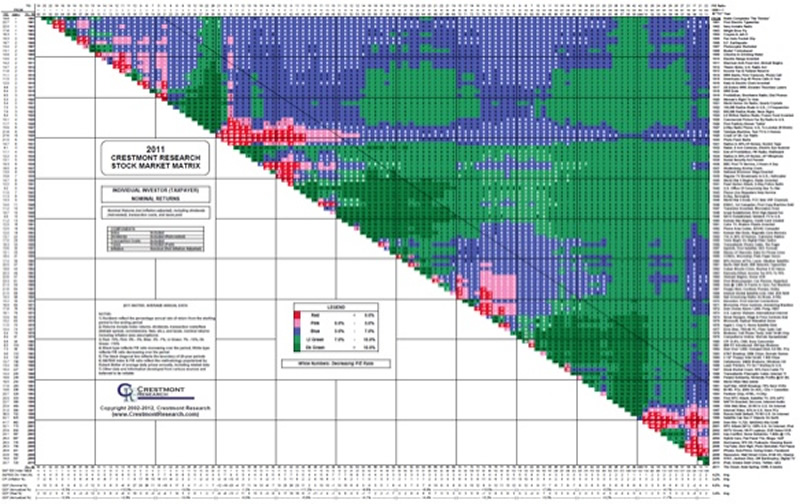
Readers of the hardcover edition of Bull's Eye Investing will remember that it included addition unique to investment books. In chapter five readers found a full-color, three-leaf pullout of one of Crestmont's most-recognized charts. The Matrix is a colorfully insightful mosaic of more than 5,000 historical investment periods over the past century. It presents the returns and more for every starting year and ending year since 1900.
The most powerful aspect of the Matrix is its ability to highlight the pockets of above-average and below-average returns for investors with decades-long horizons, while also demonstrating the calm, long-term average available only to investors with century-long horizons. When Bull's Eye Investing was published, the early signs of a secular bear were just appearing on the edge of the chart. With the Matrix now updated with nine more years of results, it's becoming clear that this may be one of the worst periods of stock market returns.
Let's take a moment to explain the layout of the chart. There are three columns of numbers down the left-hand side of the chart and three rows of numbers across the top of the chart. The column and row closest to the main chart reflect every year from 1900 through 2002. The column on the left side serves as our start year and the row on the top represents the ending year. The top row has been abbreviated to the last two numbers of the year, due to space constraints. Therefore, if you want to know the annual compounded return from 1950 to 1973, look for the row with the year 1950 on the left and look for the intersecting column labeled "73" (for 1973). The result on the version titled "Taxpayer Nominal" is 8, reflecting an annual compounded return of 8 percent over that 23-year period. Looking out another nine years, the return for 32 years drops to 6 percent after tax. (Note: Crestmont revised the Matrix to include lower transaction costs after 1975; thus, the updated Matrix reflects a 7-percent return for the 32 years). If we were to use "Taxpayer Real" for the same period, returns would drop to 2 percent. Also, there is a thin black diagonal line going from top right to lower left. This line shows you what the returns are 20 years after an initial investment. This will help you see what returns have been over the "long run" of 20 years.
Also note: the return number for the above example appears in a cell that is shaded light green. The color of the cell represents the level of the return. If the annual return is less than 0 percent, the cell is shaded red. When the return is between 0 percent and 3 percent, the shading is pink. Blue is used for the range 3 percent to 7 percent, light green when the returns are between 7 percent and 10 percent, and dark green for annual returns in excess of 10 percent. This enables us to look at the big picture. While long-term returns tend to be shaded blue, shorter-term periods use all of the colors.
Additionally, some of the numbers are presented in white, while others are black. If the P/E ratio for the ending year is higher than the P/E for the starting year – that is, if the P/E ratio was rising – the number is black. For falling P/E ratios, the color is white. In general, red and pink return cells most often have white numbers, and the greens and blues have black numbers. The P/E ratio for each year is presented along the left side and along the top of the chart.
This theme of rising and falling P/E ratios and the corresponding rise and fall of the stock market is one we are going to return to again and again. If you can understand this dynamic, you will be far ahead of most investors in the race to a comfortable retirement.
Finally, there is additional data included on the chart. On the left side of the chart, note the middle column of numbers. And across the top of the chart note the middle row. Both series represent the index values for each year. They are used to calculate the compounded return from the start year to the end year. Along the bottom of the chart, Crestmont included the index value, dividend yield, inflation (Consumer Price Index), real GDP, nominal GDP, and the 10-year annual compounded average for both GDP measures. For the index value, keep in mind that the S&P 500 Index value for each year represents the average across all trading days of the year.
Down the right side, there's an arbitrary list of developments for each of the past 103 years. In compiling the list of historical milestones, it was quite interesting to reflect upon the past century and recall that the gurus of the 1990s actually believed that we were in a "new economy" era. Looking at the historical events, it could be argued that almost every period had reason to be called a "new economy." But that's an argument for another day.
For perspective, here's a small image of the version of the Matrix that was included in the book. The full-sized image of "Taxpayer Nominal" (and all other versions) can be found on the Crestmont Research website, at http://www.crestmontresearch.com/stock-matrix-options/.
First, don't try to read the numbers in the image below. Instead, treat it like a Magic Eye chart. Just look at the color pattern. You will note that the pockets of reds and greens along the center horizon reflect high- and low-return periods. In Bull's Eye Investing, the lower right-hand corner of the chart included only the first two columns of red. The addition of nine more columns makes it clear that this is a significant secular bear. Given current valuations and expected future returns, we're likely to see a lot more red columns before the secular bear ends. The observations from Bull's Eye Investing remain true today.
Quoting from the book:
As we consider the story that the matrix begins to tell, several observations are initially apparent. There are clear patterns of returns relating to the secular bull and secular bear cycles. The periods of red and pink alternate with periods of blue and green. Once the new period starts, it tends to persist for long periods of time. Though the very long-term returns have been positive and near average, investment horizons of 10 years, 20 years, and even longer aren't long enough to ensure positive or acceptable returns.
Note also that we've recently completed the longest run of green years in the past century. Though we've had a couple of down (red) years lately, it has hardly helped to restore the long-term average to "average." We have quite a distance to go to complete what the mathematicians refer to as "regressing to the mean." As you look back over the past 100 years, there has never been a period where "the "red bear" stopped after a few short years and morphed into a "green bull."
Secondly, when you look at the "Taxpayer Nominal" chart, you will notice that the returns tend to be in the 5 to 7 percent range [only!] after long [again, repeat the word long several times] periods of time. Often nominal returns are 5 percent or less over multiple decades. Again, the charts clearly show the most important thing you can do to positively affect your long term returns is to begin investing in times of low P/E ratios.
Conclusion, Again
We concluded chapter six with a summary section titled "What Does It Mean?" It was definitive. We did not pull our punches and did not hesitate to be specific about the environment in front of us. Low returns, slow growth, and declining P/Es – they have all happened, but they are not over.
As we've discussed here through charts and writings, the current P/E for the stock market is near the level where all previous secular bears started. Since the inflation rate did not diverge far from price stability over the past nine years, we made only minor progress on the P/E path toward lower levels. We have clearly been in secular-bear waters, nonetheless. This also means that our expectation of a "decade or more" of secular bear conditions was not overstated. When I wrote Bull's Eye Investing, the P/E level was still high, after the decline of the early 2000s. It was still so high that the magnitude and/or the duration of this secular bear were destined to set records. We concluded:
For the past two chapters, we've considered statistical, cyclical, and fundamental reasons that stock market returns are likely to be less than average over the next decade or more. However, a sharper near-term retreat could hasten the next cycle. The confluence of factors that produced the historic secular bull market of the 1980s and 1990s is now positioned to leave few options for consistent near-term returns.
What we are saying is that P/E ratios are going lower–potentially much lower than current ratios. This can happen by either the market moving sideways for a long period of time as earnings growth catches up or a drop in prices to where P/E ratios are consistent with a secular bear market cycle bottom.
If inflation returns and interest rates rise, P/E ratios will trend downward. If deflation takes hold and economic malaise results, P/E ratios will also tend downward. Even if inflation and interest rates remain low and stable, the growth rate in the economy and earnings is likely to be below average, as we remain in the Muddle Through Economy for an extended period of time. This would mean that the market could move sideways for a considerable period of time waiting for earnings to catch up.
In each of these instances, especially given the existing high P/E ratio of the stock market, returns from equities can be expected to be below average or negative for many years. This is consistent with the bull and bear secular market analysis detailed in the previous chapter. As well, the environment will be volatile and choppy, consistent with the profile of secular bear markets.
Sadly, the period of low or no returns is not likely to be over soon. P/E has a long way to decline before the end of this secular bear. We can get to the lower P/E ratios that typify the end of a secular bear market and the beginning of a secular bull market by either going sideways (with lots of volatility) for a long time, while earnings continue to rise, or we can see a serious collapse of the price of stocks in a short cyclical bear market. While we suspect the former is more likely, given the various crises afoot in the world and a US government that has the potential to not respond correctly, a serious cyclical bear market cannot be ruled out.
Either way, the next few years or perhaps the entire next decade will be frustrating for investors, as the market continues its rollercoaster ride to nowhere. And given the correlation between US markets and world markets, the coming period is likely to be frustrating in more places than just the US. But savvy investors with diversified and well-developed portfolios will not only ride out the storm, they are likely to achieve investment success. There will be winning stocks and strategies in even the worst bear markets. An emphasis on absolute returns and alternative investment portfolios will be rewarded. Hang on and prepare for interesting times.
************
As we wrap up, we should note that Ed wrote a must-read book about secular stock market cycles. Unexpected Returns: Understanding Secular Stock Market Cycles is the authoritative book about long-term market cycles and the fundamental reasons that they occur. The book is packed with extensive full-color charts and graphs and is written for all investors. Here's a link to it at Amazon: www.amazon.com/Unexpected Returns.
And John has condensed Bull's Eye Investing to a version for Wiley called The Little Book of Bull's Eye Investing, in which he focuses on the basics of secular cycles and absolute-return investing. The book is just out, and you can get it at your local bookstore or at www.amazon.com/Little Book of Bull's Eye Investing.
Home Again, New York, Singapore, and Back to Newport
This will be hitting your inbox while I am on the plane back to Dallas from Rome, where I am writing this letter tonight. I will be home a week and then catch a flight for meetings in Cincinnati, jet on to New York for a few more meetings, and then catch a night flight to Singapore on Singapore Air, in one of those well-reputed first-class cabins. I have always wanted to do that; but SA is not part of One World Alliance, so I fly to Asia on AA or Cathay, which are also quite nice.
I am in Singapore only a few days and then back to New York for a night (with, of course, a few more meetings, and somewhere in there I must write your weekly Thoughts from the Frontline – maybe on the way from Singapore to Frankfurt, and then sleep on the leg to NYC). Rather than fly on to Dallas and then turn right around and fly back to Rhode Island, I will simply stay in NYC and then hop over to Newport, Rhode Island on Sunday, pre-shipping a suitcase of clean clothes there, so I don't have to pack for two weeks. The tricks we learn…
I get a lot of people asking how I can travel so much (and why). I totally agree that I travel too much. The problem is that, in isolation, each trip makes so much sense. For instance, this summer, during the last week of July, I am going to get to participate in something that I find both very exciting and a unique honor. I have had the privilege of getting to know Andrew Marshall over the last few years, first in small groups and then privately. Mr. Marshall runs something called the Office of Net Assessment for the US Defense Department, and reports to the Secretary of Defense. He was appointed by Nixon in 1973, and every Secretary of Defense and US President since then has reappointed him. He is now 90 years old and shows no sign of slowing down. A few hours with him will get you right up on your toes, as he has worked with such a long list of forward-looking thinkers over the decades that it boggles the mind. He recalls seemingly every conversation. (On the matter of aging and continuing to work and keeping your act together, he is my official hero.) In the futurist world he is legend. The institutional memory he carries with him is beyond value. Essentially, the ONA develops and coordinates net assessments of the standing, trends, and future prospects of US military capabilities and potential, in comparison with those of other countries or groups of countries, so as to identify emerging or future threats or opportunities for the United States. Think of it as an internal planning think tank for the Department of Defense.
Every now and then ONA gathers a small group of thinkers to present analysis on their personal fields of expertise, and then develop a paper based on their findings. This year I have been invited to attend and speak. I will be in Rhode Island for a very full week, the day after I get back from Singapore.
My only request of them was to be able to listen to the other presentations and interact with the presenters in the evenings. They said yes. How could I not go? What kind of idiot would I be to pass this up? I get to sit in one place and listen to experts from very diverse backgrounds, hand-picked by Andy Marshall, speak on topics that will affect the future in ways I have not yet even thought about (and some I have not even considered). We will also deal with the usual topics of all kinds of technologies, geopolitics, etc.; and in the afternoons and evenings we'll gather in small groups. Although it is not clear what I will be allowed to write about that week, I will be taking notes.
So you ask how my schedule gets so busy? This is how. There are just too many cool things I have the opportunity to do, and I don't want to pass them up!
Trequanda in Tuscany was wonderful. That little village is so very relaxing to me. I stayed home most days, and my guests used the villa as a base from which to explore. But we did make it to Siena a few times, especially for the Palio, which is quite the spectacle ( http://en.wikipedia.org/wiki/Palio_di_Siena ). Well worth taking in, if you ever get the chance.
Vincente Lualdi is a reader and one of my million closest friends. He convinced his wife the contessa, Dr. Francesca Fumi, who has a doctorate in the history of art, to take us to Siena, the city where the first banks were formed and where the oldest continuously operating bank still welcomes customers, to view the nearly 700-year-old records of banking transactions in beautifully bound books. What a treasure, and one not seen on many tours. My deep thanks to Vincente and Francesca for their patience with my questions. History and art unfolded as we went from room to room, with the illustrated book covers depicting events or people of the times. As the centuries passed, the covers turned into actual paintings. Seven hundred years of banking details – wow.
A couple of other people should be thanked. We stayed once again at the La Casa dei Fiordalisi. It is a remarkable place, with six bedrooms; and the chefs they can arrange, plus the regional restaurants, are simply over the top, with one regional destination place, il Conte Matto ("The Mad Count") 50 yards from the door. Plus the obligatory little lunch place, pizza, and small stores. A full food store is only a few miles away.
And for the second year in a row we went to the Castiglion del Bosco, a famous winery and resort founded by the Ferragamo family and run by my friend Simone Pallesi. Fabulous spa and sports facilities, sitting above the ruins of a 1,000-year-old castle tower. You should plan to spend at least three (we spent five) hours at the Ristorante Campo Del Drago. One of the finest meals of my life. Someone told me afterwards they had brought over 17 different items/courses, each better than the last. The weather was perfection, and we sat outside for much of the time.
It is just hard to do any better than that evening. It was helped by conversations with Newt Gingrich, Neil Howe, David Tice, and others; and the topics ran the gamut. Though we got home late that evening, and others, we were regularly up even later, talking through the topics of the day.
If you can get to Castiglion del Bosco, you should; and they welcome both families and corporate retreats. Tell Simone I sent you! My closest friends might find a bottle of wine at their table (we must stick together). You can learn more at www.castigliondelbosco.com.
I have a lot to think about the next few weeks. I find I needed this time away more than I thought. I will try and make myself take more time to relax, and not get burned and stressed out. Maybe a week in August somewhere not hot, where I can work and write and work out!
It is time to hit the send button. I know the weak employment numbers beg for a comment, as does the ongoing scandal over LIBOR price fixing. Maybe one of the amazing things about that one is that it took so many decades to come out. It looks like the guilty parties are going to be everywhere. This is going to get ugly, uglier, and then get nasty. We're talking some serious malfeasance. LIBOR sets interest rates for $350 trillion in bonds and debt. The level of trust has to be there or the whole thing breaks down. And what are we to make of the apparent participation of the regulators? And central banks, whose job it is to manipulate rates, asking for help to do their work? Really? This is a most interesting story and one we will follow closely. It has serious implications for the little guys and not just the largest banks.
Time to hit the send button. My flight is in a few hours and I need to get a little sleep. Have a great week.
Your wondering why we can't get great Italian gelato in Texas analyst,
By John F. Mauldin
Outside the Box is a free weekly economic e-letter by best-selling author and renowned financial expert, John Mauldin. You can learn more and get your free subscription by visiting www.JohnMauldin.com.
Please write to johnmauldin@2000wave.com to inform us of any reproductions, including when and where copy will be reproduced. You must keep the letter intact, from introduction to disclaimers. If you would like to quote brief portions only, please reference www.JohnMauldin.com.
John Mauldin, Best-Selling author and recognized financial expert, is also editor of the free Thoughts From the Frontline that goes to over 1 million readers each week. For more information on John or his FREE weekly economic letter go to: http://www.frontlinethoughts.com/
To subscribe to John Mauldin's E-Letter please click here:http://www.frontlinethoughts.com/subscribe.asp
Copyright 2012 John Mauldin. All Rights Reserved
Note: John Mauldin is the President of Millennium Wave Advisors, LLC (MWA), which is an investment advisory firm registered with multiple states. John Mauldin is a registered representative of Millennium Wave Securities, LLC, (MWS), an FINRA registered broker-dealer. MWS is also a Commodity Pool Operator (CPO) and a Commodity Trading Advisor (CTA) registered with the CFTC, as well as an Introducing Broker (IB). Millennium Wave Investments is a dba of MWA LLC and MWS LLC. Millennium Wave Investments cooperates in the consulting on and marketing of private investment offerings with other independent firms such as Altegris Investments; Absolute Return Partners, LLP; Plexus Asset Management; Fynn Capital; and Nicola Wealth Management. Funds recommended by Mauldin may pay a portion of their fees to these independent firms, who will share 1/3 of those fees with MWS and thus with Mauldin. Any views expressed herein are provided for information purposes only and should not be construed in any way as an offer, an endorsement, or inducement to invest with any CTA, fund, or program mentioned here or elsewhere. Before seeking any advisor's services or making an investment in a fund, investors must read and examine thoroughly the respective disclosure document or offering memorandum. Since these firms and Mauldin receive fees from the funds they recommend/market, they only recommend/market products with which they have been able to negotiate fee arrangements.
Opinions expressed in these reports may change without prior notice. John Mauldin and/or the staffs at Millennium Wave Advisors, LLC and InvestorsInsight Publishing, Inc. ("InvestorsInsight") may or may not have investments in any funds cited above.
Disclaimer PAST RESULTS ARE NOT INDICATIVE OF FUTURE RESULTS. THERE IS RISK OF LOSS AS WELL AS THE OPPORTUNITY FOR GAIN WHEN INVESTING IN MANAGED FUNDS. WHEN CONSIDERING ALTERNATIVE INVESTMENTS, INCLUDING HEDGE FUNDS, YOU SHOULD CONSIDER VARIOUS RISKS INCLUDING THE FACT THAT SOME PRODUCTS: OFTEN ENGAGE IN LEVERAGING AND OTHER SPECULATIVE INVESTMENT PRACTICES THAT MAY INCREASE THE RISK OF INVESTMENT LOSS, CAN BE ILLIQUID, ARE NOT REQUIRED TO PROVIDE PERIODIC PRICING OR VALUATION INFORMATION TO INVESTORS, MAY INVOLVE COMPLEX TAX STRUCTURES AND DELAYS IN DISTRIBUTING IMPORTANT TAX INFORMATION, ARE NOT SUBJECT TO THE SAME REGULATORY REQUIREMENTS AS MUTUAL FUNDS, OFTEN CHARGE HIGH FEES, AND IN MANY CASES THE UNDERLYING INVESTMENTS ARE NOT TRANSPARENT AND ARE KNOWN ONLY TO THE INVESTMENT MANAGER.
John Mauldin Archive |
© 2005-2022 http://www.MarketOracle.co.uk - The Market Oracle is a FREE Daily Financial Markets Analysis & Forecasting online publication.