


Stock Market Tug o' War Between Bulls and Bears
Stock-Markets / US Stock Markets Feb 02, 2008 - 07:51 PM GMTBy: Dominick
 If the palpable struggle between the bulls and bears was not obvious this week, from early on Monday, through the Fed announcement, and right up to Friday's close … I'm not sure you're paying attention. But even if you could feel the tension, there's nothing like a few charts to really spell out the situation.
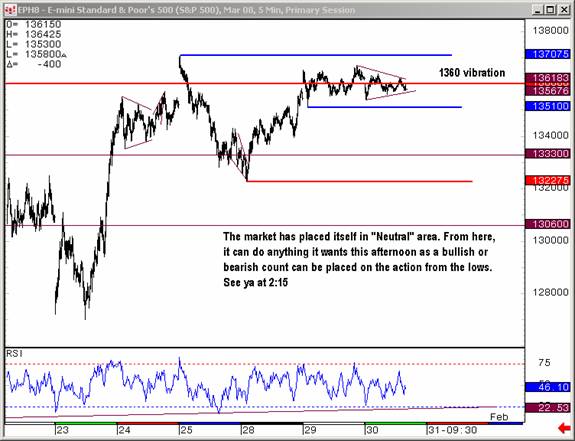
One of the most telling features of this battle between the bulls and bears was the two-day vibration around 1360 going into the Fed announcement. Remember 1360 was an upside target from summer '06 and a “wake up call” early this month. Recognition like this from the market gives us confidence our numbers are real and tradable. Into Wednesday afternoon either side could have taken over, but the triangle forming during the week tilted expectations to the upside.
Even before the statement was out and the market rally started gaining traction, we had the target for a measured move and were ready to get out even sooner if necessary as the kissback to last year's broken triangle was directly above. As you know, Moody's downgrade hit the tape in the final hour that afternoon and we were lucky to have a target close by and reasons to already have us thinking about exiting our trades, taking profit and preserving capital.
The cascade down that followed, is a reminder that the volatility we promised for 2007 and 2008 is still here and not about to quit. It also emphasizes this is a market to trade, but only with an understanding of your positions and leverage. A move like the one we saw Wednesday afternoon is enough to take you right out of this business if you're not careful. Traditional methods of analysis seem to be breaking down, but the rigor of our unbiased approach continues to flourish. While most were ogling a very bearish reversal candle, feeling invigorated about their bullish counts, we were eyeing longs!
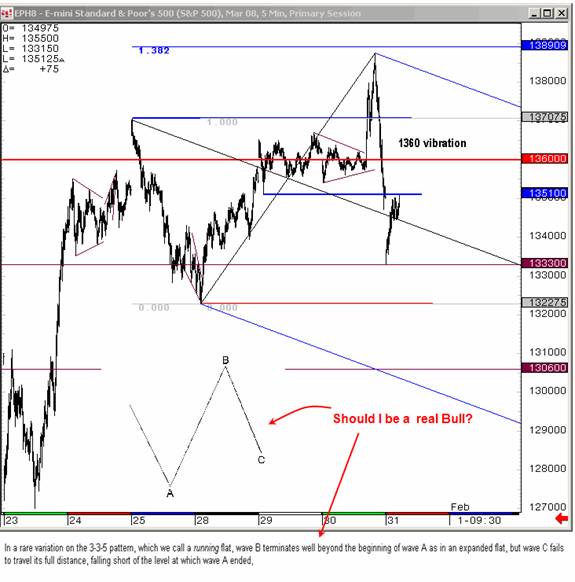
Because, what makes this the chart of the week, I think, is the emergence of a pattern from the January 25 high that is extremely bullish. Where most were seeing a powerful wave 1 down off the potential downgrades and a wave 2 retrace, this bigger picture reveals what is shaping up to what's called a “running flat.” You can read the details at the bottom of the chart above if you're unfamiliar with this pattern, but the bottom line is that it is very bullish. This was part of what allowed us to buy the low of the move in overnight trading and add to the position once the market rallied the next day.
I won't lie to you though, I was up for hours that night pouring over charts, trying to decide what to post. It was a tough call to make, but looking it all over and feeling that we'd only hit a good area for profit taking and not a top (remember the 1389 target above and the kissback) we bought the overnight low and put the onus on the bears Thursday morning to prove their case. Otherwise, getting back above 1360 would clear the way higher.
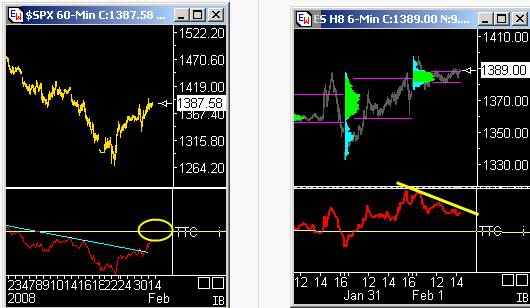
As bulls took a more definite advantage of the situation in the last two days of the week, we were well positioned to profit. Guiding us towards a level to TMAR (take the money and run) were our proprietary RSI indicators, shown below. The 60-min RSI on the right was particularly useful. Breaking the downtrend line in the oscillator kept us long into Friday afternoon for a move up into the zeroline.
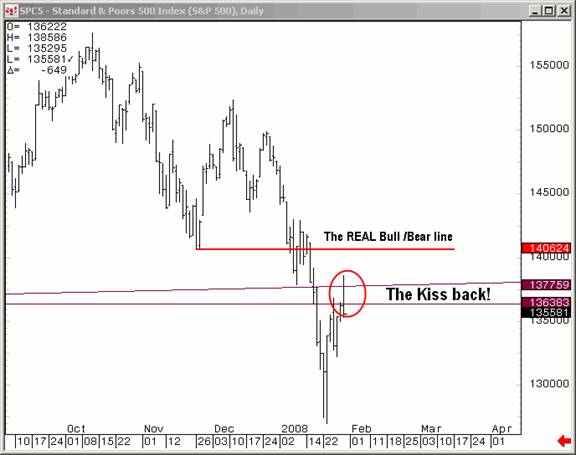
Friday's close put us in the vicinity of the multi-month triangle we'd been following the end of last year, shown below, the break of which was a signal of new lows and probably sparked massive put buying. Of course those puts are probably worthless now if not discarded.
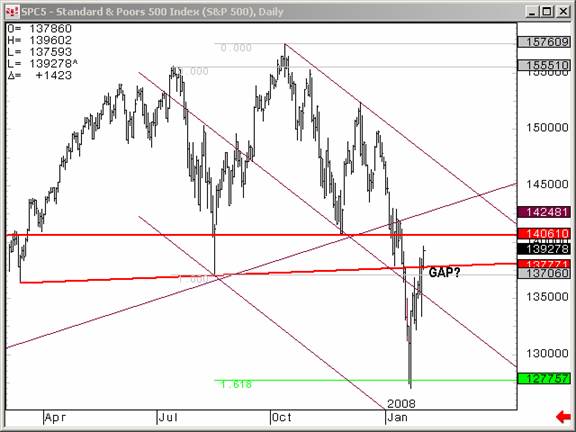
I described a few weeks ago how some members might have been discouraged at the triangle break and felt they'd missed an opportunity to hold a short down from the top. Of course, we got in on the downside action at the break of 1360 and, more importantly, bought the exact bottom at 1256, a number you probably won't see on anyone else's charts. The rally from there has already been upwards of 10%, about 140 points in just two weeks – more than total gain of the S&P 500 in all of 2007! The point, of course, is that unbiased trading may not capture every last tick of a move, but it far outperforms the buy and hold method!
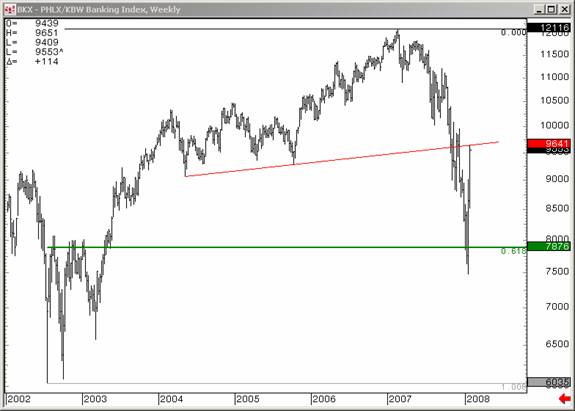
The multi-year chart of the banking index above also underscores the value of technical analysis and trading. Almost a year ago we began to observe divergence between financial and the broader market, and this pattern continued right into the October highs. Recently, we've been suggesting the BKX would bottom and its bounce would be a catalyst for the entire S&P. Notice this crashing market ran over the .618 traders, but did in fact bounce shortly thereafter. Though some members were initially uneasy with that call, the rapid follow-through has made some new believers. The chart counters the argument that declines are always sharp and rallies always slow and grinding since in the banks we see the exact opposite: a gradual deterioration through 2007 that has now retraced 50% up in two weeks. That this index has conveniently perched itself at an old multi-year trendline we find to be more than mere coincidence.
Friday's close certainly left things in an interesting position. Continuing the rally off our perfect 1256 ES buy, if we go for another high here, and we have a reserved pattern that does exactly that, I think it's safe to say no one but TTC has been consistent throughout that the high in October is not set in stone and is not necessarily a done deal. Though there is a bear case to be made here, it needs to be proven, and soon, because a complete corrective pattern from bottom to top is now in place and looks good.
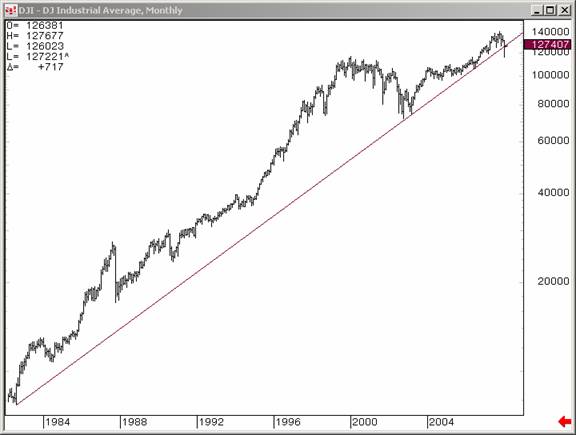
Remember the chart above was also shown last week with the explanation that the big picture is really starting to matter now. If this is a tug of war, both sides have been pulled right up to the edge a few times so far, but neither side has completely given in and been invalidated either. What's important to keep in mind, and the chart above emphasizes this, is that it's less important to worry about whether a top or bottom is in place than it is to know the direction of the next move and to trade. The bull and bear battle will continue next week, so in the meantime we continue to use big picture parts as part of our overall approach to explore, trade and make money while the jury is out on the ultimate outcome.
So, do you have what it takes to trade this market? Readers have enjoyed and profited from this newsletter for the past two years. Over that time TTC has improved and evolved, and this process is ongoing. The next phase will see the frequency of this newsletter slowing down as I not only devote more time to our family of traders, but I also spend more time with my own family! If you're a regular reader, you probably already know that sometime this spring TTC will close its doors to retail investors and focus on existing members. Last weekend's Saturday Elliott education forum was not only fun, but enlightening for a lot of members who enjoy the give and take of our trading community. I think we'd all benefit from having time to do more activities like that.
But, once we've closed the doors, only institutional traders will be permitted to join. If you're a retail trader/investor who wants to take advantage of our proprietary targets, indicators, forums and real time chat, and trade alongside the pros, this is the time to join before the lockout starts. At that point, the only way in will be a waiting list that we'll use to accept new members from time to time, perhaps as often as quarterly, but only as often as we're able to accommodate them. So, don't get locked out later, join now!
Have a profitable and safe week trading, and remember: "Unbiased Elliott Wave works!"
By Dominick , a.k.a. Spwaver
www.tradingthecharts.com
This update is provided as general information and is not an investment recommendation. TTC accepts no liability whatsoever for any losses resulting from action taken based on the contents of its charts, commentaries, or price data. Securities and commodities markets involve inherent risk and not all positions are suitable for each individual. Check with your licensed financial advisor or broker prior to taking any action.
Dominick Archive |
© 2005-2022 http://www.MarketOracle.co.uk - The Market Oracle is a FREE Daily Financial Markets Analysis & Forecasting online publication.