Why Gold Doesn't Need the Fed
Commodities / Gold and Silver 2012 Sep 01, 2012 - 03:28 AM GMTBy: Clif_Droke
 Gold was a star performer during the month of August, outshining other assets in an impressive rally which took many investors by surprise. Many analysts attributed gold's strength to investors' expectations of another monetary rescue operation from the Federal Reserve. But as we'll see in this commentary, such an action is not only unlikely but unnecessary to gold's continued strength.
After a vigorous rally last week, gold investors adopted a cautious tone ahead of Friday's annual gathering of central bankers and finance ministers at Jackson Hole, Wyoming. During the 2-day meeting, investors will be on the lookout for verbal hints that the U.S. Fed may implement another monetary stimulus, which would benefit the gold price. Ultimately, hopes of another quantitative easing (QE) program will likely be disappointed due to a recent spate of positive economic and consumer spending reports. But this doesn't mean gold won't be able to benefit from the other economic variables in the mixing pot. Let's take a look at some of these variables.
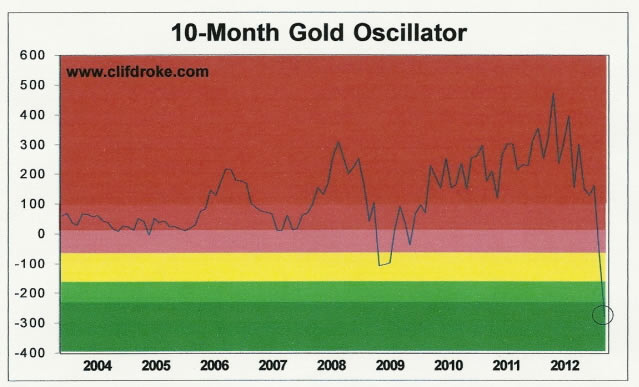
A weak dollar helped propel gold's breakout in August. In recent days, the story behind gold's rise and the dollar's weakness has been investors' expectation of a third quantitative easing (QE) program in the near future, which would benefit the yellow metal and hurt the greenback. A more likely explanation is that savvy investors see more trouble on the horizon from still unsolved euro zone debt crisis. These investors are taking advantage of gold's historical "oversold" technical signal from earlier this summer and have been heavily accumulating gold as a safe haven investment. As a reminder of how oversold gold had become on a longer-term basis I bring to your attention once again the following graph showing the 10-month price oscillator for gold.

As discussed in previous commentaries, anytime this important indicator reaches an "oversold" reading it has always represents an excellent buy signal for gold from an intermediate-term to longer-term standpoint. The indicator has once again proved its merit following gold's latest breakout and rally.
Underscoring just how much investors fear for their financial safety, the World Gold Council (WCG) recently reported that European purchase of bullion bars and coins rose 15%. This reveals investors' demand for gold for capital preservation in light of the European debt and banking crises. The WGC emphasized that Russia will continue to be a driving force in the gold market. It is now the fourth largest consumer of gold jewelry and has the world's eighth largest gold reserves. There are enough economic crises out there on the horizon to keep gold buoyant for some time to come.
Looking beyond 2012, gold will have the additional support of increasing financial market volatility in the 2013-2014 period. During this time the 60-year cycle will be in its final descent before bottoming in late 2014. This cycle will be responsible for all kinds of deflationary pressures throughout the global economy, and this should benefit gold. Keep in mind that gold benefits from both ends of the 60-year economic super cycle, namely runaway inflation and runaway deflation. Accordingly, gold should prove to be the ultimate financial safe haven in the coming two years.
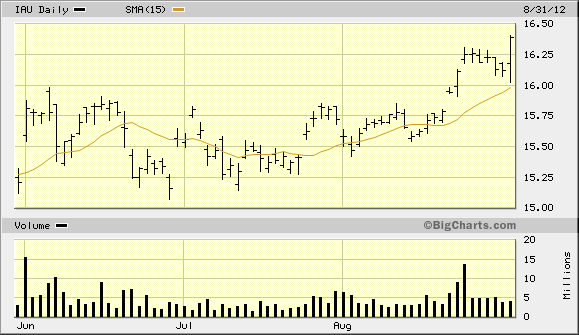
Turning our attention to the short-term technical outlook for gold, the iShares Gold Trust ETF (IAU), my favorite gold proxy, confirmed an immediate-term breakout per the rules of the 15-day moving average trading method in late July. Since then IAU has rallied 4 percent, which is the minimum expectation of what the trading discipline tells us. Historically, buy signal generated by the 15-day moving average (unless there is a bear market underway) result in a minimum advance of 4 percent, with a maximum average gain of 8-10 percent before the first correction begins. Under optimal conditions, we would expect the gold ETF to gain an additional 4-6 percent gain before commencing its next correction phase.

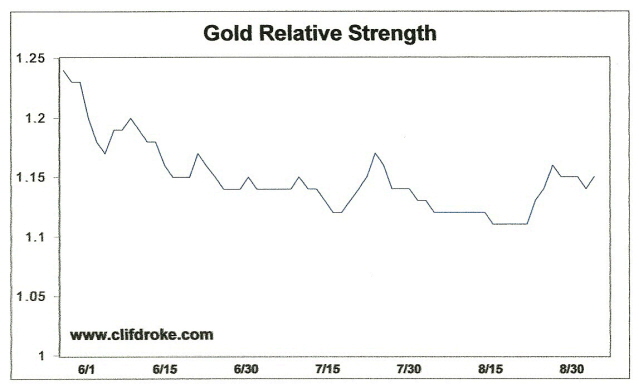
"Optimal conditions" is the operative term here. Every rose has its thorn, and so does every bull market. The proverbial thorn in gold's side right now is a lack of corresponding relative strength. Although gold's price has risen impressively, the gold relative strength indicator has so far failed to confirm the higher high in the gold price. The following graph illustrates this problem.

Unless there is a rapid increase in gold's relative strength in the next few days, the lagging nature of this indicator suggests that gold will remain vulnerable to a correction before achieving its full upside potential based on the historical pattern. This is strictly a short-term consideration, however, as the fundamentals for the longer-term bull market in gold are still firmly intact.
2014: America's Date With Destiny
Take a journey into the future with me as we discover what the future may unfold in the fateful period leading up to - and following - the 120-year cycle bottom in late 2014.
Picking up where I left off in my previous work, The Stock Market Cycles, I expand on the Kress cycle narrative and explain how the 120-year Mega cycle influences the market, the economy and other aspects of American life and culture. My latest book, 2014: America's Date With Destiny, examines the most vital issues facing America and the global economy in the 2-3 years ahead.
The new book explains that the credit crisis of 2008 was merely the prelude in an intensifying global credit storm. If the basis for my prediction continue true to form - namely the long-term Kress cycles - the worst part of the crisis lies ahead in the years 2013-2014. The book is now available for sale at: http://www.clifdroke.com/books/destiny.html
Order today to receive your autographed copy and a FREE 1-month trial subscription to the Gold & Silver Stock Report newsletter. Published twice each week, the newsletter uses the method described in this book for making profitable trades among the actively traded gold mining shares.
By Clif Droke
www.clifdroke.com
Clif Droke is the editor of the daily Gold & Silver Stock Report. Published daily since 2002, the report provides forecasts and analysis of the leading gold, silver, uranium and energy stocks from a short-term technical standpoint. He is also the author of numerous books, including 'How to Read Chart Patterns for Greater Profits.' For more information visit www.clifdroke.com
© 2005-2022 http://www.MarketOracle.co.uk - The Market Oracle is a FREE Daily Financial Markets Analysis & Forecasting online publication.


