


Silver Commercials Short Covering to Result Price Spike
Commodities / Gold & Silver Feb 07, 2008 - 10:52 AM GMTBy: Roland_Watson

 One major theme that unites a lot of silver investors is the matter of the major short sellers of silver. To be more precise, the well known fact is that the class of silver traders known as the commercials has been net short silver for literally decades. The chart below demonstrates this fact quite readily. The silver price is in green and the net commercial position in black (a negative number indicates a collective short position).
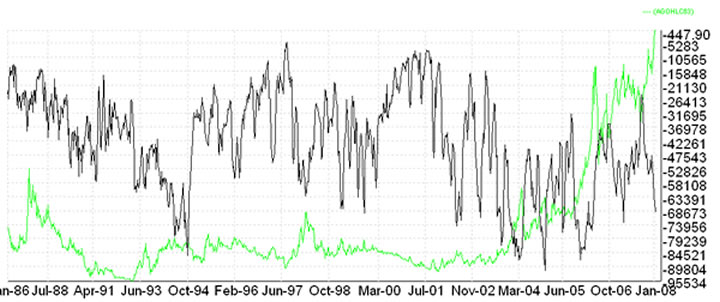
For the last 21 years and presumably longer, the net position of the commercial traders has been short on silver. Note this is the "net" commercial position on silver. Commercial traders do go long silver as well but the number of times they have taken the short side of a contract has consistently outweighed their long side on other contracts over a span of three decades or more.
Note further that I am not saying the market as a whole has been short silver for 21 years. Since every short side of a contract is balanced by someone taking the long side of the same contract then the market is always net zero in terms of contracts. Rather it is the price of silver and to a lesser extent the open interest that function as indicators of the market's sentiment towards silver.
With that background in mind, we come to the matter of the commercial short positions. One theory regarding this "eternal" short position by the commercials is that there is a scheme in place to keep a lid on the price of silver. This is particularly leveled at a small number of commercials who hold a high proportion of the short positions and are accused of collusively pulling bids or initiating waves of short orders to create a sell off. Other commercials will simply be hedging their production against price drops in the manner this market was created for but this small group whose composition is not revealed by the CFTC is singled out for criticism.
One conclusion of this theory is that a rising silver price will eventually force the shorts into covering their massive losing positions by going long silver at higher prices and thus creating a massive silver price spike.
The thesis of this article is that this has already happened and not once but twice and may happen for a third time. The silver shorts have already capitulated in other words. Take a look at the same chart zoomed into the past five years.
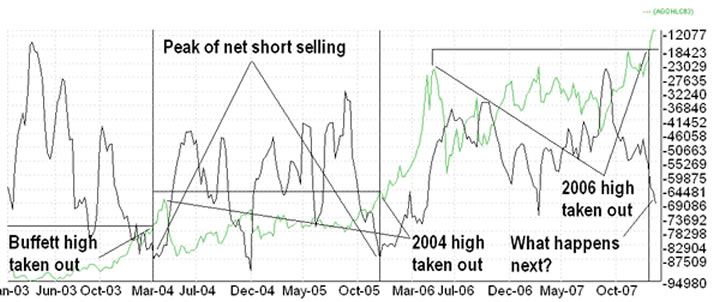
As you can see, I have a few things to say here. If a concerted short selling blitz was in operation to drag down the silver price then one may naturally assume the net commercial short position would increase negatively as the price of silver increased positively until the "job was done" and the silver price collapsed. This graph says differently.
Note that the NCSP (net commercial short position) increased steadily as the 2004 bull progressed. However, at a level of about -87,000 contracts and a full month before the silver spike peaked at over $8.50, the NCSP began to decrease until by the time of the spike it had fallen 5% to -83,000 and continued to fall -46,000 as the shorts took advantage of the silver price collapse to clear out their positions.
So, clearly the resultant price drop in silver cannot be attributed to a sustained attack by the commercials based on this graph. The implication of the graph is that the shorts began to cover weeks before the rise in the price of silver caused more problems for them.
Now look at the same situation in 2005-2006. Once again a peak in the NCSP occurred before the spike in silver prices at a NCSP of -87,000 contracts. But note the capitulation by the shorts began not weeks but months before the blow off. In fact, it occurred a full FIVE months before in December 2005. Also note that the capitulation began at the point where the old 2004 price highs were decisively taken out. In other words, a new run up in the price of silver was on the cards and the commercials knew it - abandon ship! Accordingly they reduced their short positions by a massive 56% as the bull ran riot.
This may also explain why the 2004 capitulation took place when it did at a silver price of $7.11, a line drawn out to February 1998 shows that this was the point at which the 2004 bull exceeded the old highs set by the Warren Buffett spike. Was this mere coincidence or an important breaking of old resistance levels?
Clearly from these two graphs, we see that the commercial shorts were not too keen on continually increasing their collective short position in the face of a silver buying mania. After all, they do not have bottomless pockets. But what of the current position?
Now we stand at a point where the previous highs of 2006 have been decisively taken out. The current NCSP stands at about -70,000 and so far shows no signs of capitulation. Will history repeat and the commercials shorts start reducing their positions about now? Perhaps, only time will tell but I would note that the previous maximums of the NCSP were both about -87,000 which suggests there may be further room it to increase. Also note that based on the two previous episodes this does not imply a silver price drop will automatically follow. I say this because when the NCSP rose from -70,000 to -87,000 in the two last bull runs, the price of silver increased 30% and 12% respectively.
So what is the conclusion of the matter? If there is collusion amongst certain traders to cap or smash the price of silver it is not apparent in the graphs presented. There may well be collusion but either they are doing it so ineptly as to be ignored or they are doing via other mechanism beyond the scope of this article.
By Roland Watson
http://silveranalyst.blogspot.com
Further analysis of the SLI indicator and more can be obtained by going to our silver blog at http://silveranalyst.blogspot.com where readers can obtain the first issue of The Silver Analyst free and learn about subscription details. Comments and questions are also invited via email to silveranalysis@yahoo.co.uk .
Roland Watson Archive |
© 2005-2022 http://www.MarketOracle.co.uk - The Market Oracle is a FREE Daily Financial Markets Analysis & Forecasting online publication.