Are Falling Crude Oil Prices Predicting A Stock Market Fall?
Commodities / Crude Oil Sep 30, 2012 - 10:47 AM GMTBy: Sy_Harding
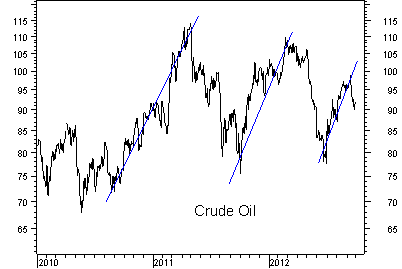
 When the economy slowed in the summer of 2010 and the Fed launched QE2, commodity prices took off like a SpaceX rocket. The price of crude oil reversed to the upside along with the stock market, surging up 64%, from $70 a barrel to $114 a barrel eight months later in April, 2011.
When the economy began to slow again in the spring of 2011, the stock market declined again and oil prices fell back to $75 a barrel by October. The Fed then launched ‘operation twist’, again adding liquidity to the financial system, and the price of oil reversed to the upside, along with the stock market, oil reaching $109 a barrel six months later in March of this year.
This year as the economy slowed yet again, oil plunged back to a low of $75 a barrel in June. This time, as hopes grew that the Fed would come to the rescue again, neither oil nor the stock market waited, but began rallying again purely on the hopes for Fed action. The price of crude oil reached $100.40 a barrel two weeks ago.
When the Fed did indeed announce its QE3 program, it was widely expected that commodity prices, including oil prices, would surge higher as they did after QE2 and ‘operation twist’.
But it didn’t happen, at least not yet.
Instead, over the last two weeks the CRB Index of Commodity Prices has declined 5.5%, and oil has plunged 11%, from $100.40 a barrel two weeks ago to $89 a barrel this week.

It has traders scratching their heads.
Is it that the Fed’s action was already factored into oil prices this time in the rally on hope from the June low? Or maybe that global economies are in such slides that the Fed action (and that of the European Central Bank) is too little too late to prevent a global recession?
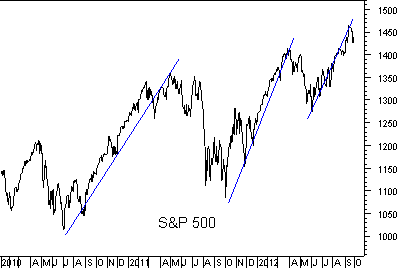
Meanwhile, is the plunge in the price of oil an ominous sign for the stock market? I ask since the price of oil seems to track very closely with the stock market, as well as with economic slowdowns and recoveries.

In any event, this week’s economic reports seem to answer the question of what the Fed saw coming when it decided to provide an aggressive QE3 stimulus effort in spite of signs of improvement in the housing industry.
The week’s reports include that the Chicago Fed’s National Business Index, calculated from 85 individual economic reports, plunged further in August. Its three-month moving average, considered a recession indicator, fell from -0.26 in July to -0.47 in August. That was its 6th straight negative reading. And 2nd quarter GDP growth was unexpectedly revised down to just 1.3% from the previously reported dismal 1.7%. And Durable Goods Orders plunged 13.2% in August. Providing a more recent picture, the Chicago PMI Index fell below the 50 level that marks expansion and contraction in September, coming in at 49.7, its lowest level in three years.
Combined with the ominous decline in oil prices, indicating QE3 may not have the same positive impact as QE2 and operation twist, this week’s additional dismal economic reports are providing a warning to investors that October may be a difficult month this year.
Those inverse etf’s against the market, PSQ, DOG, SH, and RWM are looking attractive again.
Sy Harding is president of Asset Management Research Corp., and editor of the free market blog Street Smart Post.
© 2012 Copyright Sy Harding- All Rights Reserved
Disclaimer: The above is a matter of opinion provided for general information purposes only and is not intended as investment advice. Information and analysis above are derived from sources and utilising methods believed to be reliable, but we cannot accept responsibility for any losses you may incur as a result of this analysis. Individuals should consult with their personal financial advisors.
© 2005-2022 http://www.MarketOracle.co.uk - The Market Oracle is a FREE Daily Financial Markets Analysis & Forecasting online publication.


