FTSE 100 Stock Market Index Showing Remarkable Strength
Stock-Markets / UK Stock Market Feb 14, 2008 - 04:28 AM GMTBy: Nadeem_Walayat

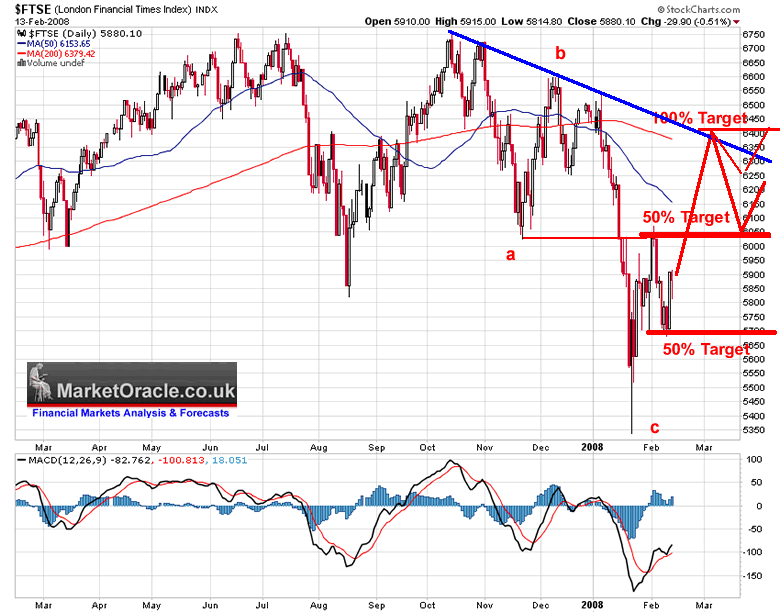
 The FTSE 100 Indexes January plunge to below 5350 set up the scenerio for a relief rally towards resistance at 6000, which would again be followed by a retest of the January lows the outcome of which was set to determine the trend for much of the year. On Wednesday, the FTSE managed to recoup much of the days earlier losses that had seen the FTSE decline to a low of 5814, closing just 30 points down on the day at 5890, this is evidence of remarkable strength in the light of an anticipated reaction towards the January low of 5350 following a break of 50% of the advance to the 6071 relief rally peak.
Despite the fundamental picture for the UK economy being undoubtedly bearish with UK inflation on the rise, economy slowing, house prices flat-lining, however the stock markets tend to look ahead of the curve and is in fact signaling a much rosier picture going forward, which is contrary to the pervading bearish sentiment.
The analysis of 23rd January at the height of the stock market panic called for a rally over the next 2 weeks followed by a retest of the lows which would determine the trend for next major move. The FTSE put in a bottom in January at 5339, therefore this implied a target for the relief rally at 50% of the decline to 6045. This target was reinforced by support along the 6026 low made earlier in November 07. The relief rally managed to break higher above the support of 6026 and the 50% retracement level of 6045. The analysis of 4th Feb 08 stated that the strength of the relief rally was a strong indicator of a weak retest of the Jan lows and therefore bodes well for stock market strength going forward.

The retest of the lows has seen the FTSE 100 index decline to just 5681, coinciding with the initial target for the retest at 50% of the advance to 6071 at 5705, followed by the most probable outcome of a decline towards a slightly higher bottom than the 5340 low for the formation of a double bottom pattern. With the FTSE more or less holding at the 50% level of the decline now signaling strength going forward which implies that the current trend is targeting a break of the 6071 peak towards an initial target of 100% of the relief rally advance from the 5681 low, i.e. 6412.
The down trendline along the highs from 6750 implies that the advance to 6412 could be strong, i.e. over less than 3 weeks rather than a laboured uptrend. Following the advance to 6412, a subsequent downward correction projects to two potential targets, of 6250 and 6070. At this point I favour the trend for the correction towards 6120, i.e. the expectation is that 6070 would hold for a further swing higher towards a break of 6412 and therefore an eventual assault on the string of highs all the way to the current bull market peak of 6754. The elliott wave pattern to date resembles a simple ABC correction to the January low, therefore confirming expectations of a 5 wave move higher with two further impulse waves (3 and 5), the fifth wave of which targets a move to between 6610 6750 by sometime in late April / early May 08.
By Nadeem Walayat
Copyright © 2005-08 Marketoracle.co.uk (Market Oracle Ltd). All rights reserved.
Nadeem Walayat has over 20 years experience of trading, analysing and forecasting the financial markets, including one of few who both anticipated and Beat the 1987 Crash. Nadeem is the Editor of The Market Oracle, a FREE Daily Financial Markets Analysis & Forecasting online publication. We present in-depth analysis from over 120 experienced analysts on a range of views of the probable direction of the financial markets. Thus enabling our readers to arrive at an informed opinion on future market direction. http://www.marketoracle.co.uk
Disclaimer: The above is a matter of opinion provided for general information purposes only and is not intended as investment advice. Information and analysis above are derived from sources and utilising methods believed to be reliable, but we cannot accept responsibility for any trading losses you may incur as a result of this analysis. Individuals should consult with their personal financial advisors before engaging in any trading activities.
Nadeem Walayat Archive |
© 2005-2022 http://www.MarketOracle.co.uk - The Market Oracle is a FREE Daily Financial Markets Analysis & Forecasting online publication.


