


Stock Market Rallies Determined by Liquidity Inflows and Outflows
Stock-Markets / US Stock Markets Feb 14, 2008 - 08:58 AM GMTBy: Marty_Chenard

 If you think of logically ... when money flows into the market, stocks are being bought. When the amount of Inflowing Liquidity is in Expansion , then more and more investors are entering the market ... and that drives prices up.
However, when Liquidity is out-flowing, it is a condition where investors are removing their capital from the market. That means the impetus is on selling, and the market pulls back. When out-flowing Liquidity deteriorates to the point where the net liquidity is in Contraction, then the market experiences a correction.
Liquidity levels and its directional momentum are a key factor relative to market trending. You cannot have the market in a rally mode when Liquidity is leaving the market ... and, you cannot have the market in a correction when Liquidity is entering the market and at an Expansion level.
What does a historical Liquidity chart tell us about the market during the past 2 years?
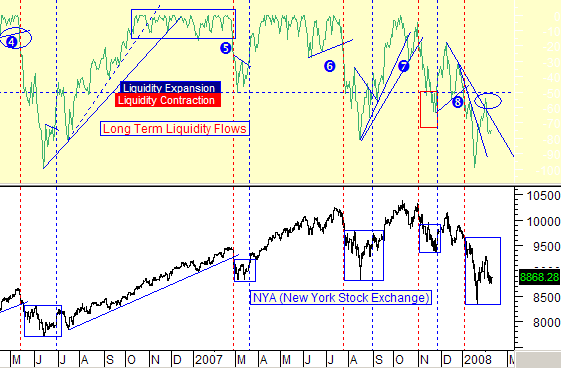
Today's chart goes back to April of 2006. On the top graph, you can see the change in Liquidity levels during that time period relative to the New York Stock Exchange.
Notice what happened to Liquidity levels since October of last year.
Inflowing Liquidity peaked in early October. Pay attention to each peak AFTER October's peak. What do you noticed that happened to those peaks?
Answer: They all made lower tops. Lower tops and lower bottoms is essentially the definition of a down trend. With Inflowing Liquidity in a down trend, the market indexes had to follow the same direction.
When was the most recent time that Inflowing Liquidity went so low that it was in Contraction?
If you look at the chart, you can see that Liquidity went into Contraction at the very beginning of January. With Liquidity in Contraction, the market had its most serious drop of the past two years.
So, what is happening to Liquidity levels now?
Currently, Liquidity is still in Contraction and in a down trend. We just had a recent lower top that is now moving down again. The critical thing to watch now is what happens ... will Liquidity make a lower bottom, or will it hold here and move up and make a higher top? If the latter doesn't happen, then this correction will continue until Liquidity inflows increase and move into Expansion territory.
(This chart is posted every day on our paid subscriber sites.)
By Marty Chenard
http://www.stocktiming.com/
Please Note: We do not issue Buy or Sell timing recommendations on these Free daily update pages . I hope you understand, that in fairness, our Buy/Sell recommendations and advanced market Models are only available to our paid subscribers on a password required basis. Membership information
Marty Chenard is the Author and Teacher of two Seminar Courses on "Advanced Technical Analysis Investing", Mr. Chenard has been investing for over 30 years. In 2001 when the NASDAQ dropped 24.5%, his personal investment performance for the year was a gain of 57.428%. He is an Advanced Stock Market Technical Analyst that has developed his own proprietary analytical tools. As a result, he was out of the market two weeks before the 1987 Crash in the most recent Bear Market he faxed his Members in March 2000 telling them all to SELL. He is an advanced technical analyst and not an investment advisor, nor a securities broker.
Marty Chenard Archive |
© 2005-2022 http://www.MarketOracle.co.uk - The Market Oracle is a FREE Daily Financial Markets Analysis & Forecasting online publication.