Gold and Silver Price Breakout!
Commodities / Gold and Silver 2012 Oct 17, 2012 - 12:11 PM GMTBy: Peter_Degraaf
 Are Gold and Silver preparing for another upside breakout? The battle is between the bullion banks with large short positions; and investors and hedge funds, (along with Asian central banks), that are protecting all or part of their net worth by owning some gold. It has been eleven weeks since my last article. In that article titled: "Gold and Silver Update" I indicated that the summer doldrums appeared to be over. Gold was trading at $1620 and silver at $28.03. I wrote that article with the observation that both metals were ready to rise, and I write today's article with a similar observation. The fundamentals have seldom been more favourable for the bull market in precious metals than they are today.
- The floodgates of monetary inflation are wide open.
- Central banks are buying - no longer selling.
- South African output continues to decline - South Africa was once the largest gold producer in the world.
- Price inflation is rising, leading to a decline in the value of bonds. This in turn creates demand for gold.
- The U.S. Federal Reserve's recent announcement of continued 'quantitative easing' puts a rising floor under the price of gold and silver.
- The large 'net short' position in the COT report has the potential for commercial traders to run for cover and reduce their 'short exposure'. This happened also in August of 2011. You may recall that the 'net short' position of commercial gold traders on August 5th was reported to be 288,000 contracts. Gold was trading at $1663. As gold began to rise (despite the large COT number), commercial traders ran for cover and by October 21st the 'net short' number was reduced to 159,000. In the meantime gold rose from $1663 to $1884 by September 2nd. (A rise of $221.00 in just one month).
- The period from U.S. Labor Day until February is historically the time of year when precious metals are at their 'most bullish'. A number of Asian countries celebrate festivals during autumn, while items of gold and silver are very popular. Meanwhile in the West we can usually count on a 'Christmas Rally' in gold and silver. I've been told that one analyst recently advised his subscribers to 'short gold'. One wonders what this man is smoking. During a bull market in gold you buy or you hold - don't be tempted to short gold!
Note: Charts in this article are courtesy Stockcharts.com unless indicated.
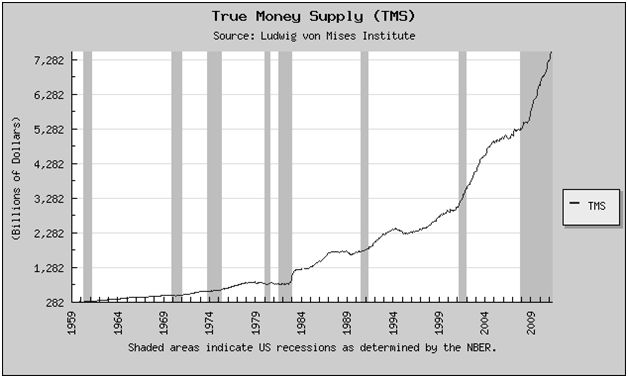
This chart courtesy Mises.org shows the True Money Supply in the USA. The rate is rising exponentially with no sign of levelling off. This trend provides energy for gold and silver to continue to rise.
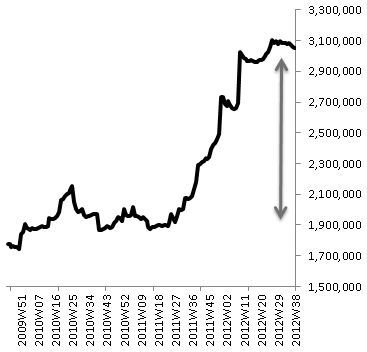
ECB balance sheet (€mm)
This chart courtesy Mybudget360.com shows the one year increase in the balance sheet at the European Central Bank.
- Worldwide money printing continues unabated
- Just In 10 years $120 trillion have been printed making global debt $200 trillion
- World GDP has gone from $32 trillion to $70 trillion 2001-2011
- Thus $120 trillion debt is required to produce a $38 trillion annual increase in GDP
- The marginal return on printed money is negative in real terms
- Thus the world is living on an illusion of paper that people believe is money
- This illusionary paper wealth will implode in the next few years
- The initial trigger will be the collapse of the world's reserve currency - the US dollar
- The dollar is backed by $120 trillion of US government debt and probably NO gold
- All currencies will continue their race to the bottom and lose 100% in real terms against gold
- This will create a worldwide hyperinflationary depression
- All assets financed by the credit bubble will go down in real terms
- This includes stocks, bonds, property and paper money of course
- The financial system is unlikely to survive in its present form
- The banking system including derivatives has total liabilities of around $1.2 quadrillion
- With world GDP of $70 trillion, the world is too small to save a financial system which is 17x greater
- This is why there will be unlimited money printing and hyperinflation
- The only asset that will maintain its purchasing power is gold.
- Gold has been money for 5,000 years and will continue to be the only currency with integrity
- Western countries' 23,000 tons of gold is probably gone. See recent article by Eric Sprott.
- The consequence is that most of the gold in the banking system is likely to be encumbered
- This means that Central Banks one day will claim it back against worthless paper gold IOUs
- Thus gold and all other assets within the banking system involve an unacceptable counterparty risk
- Gold should be held in physical form and stored outside the banking system
Courtesy: Egon von Greyerz
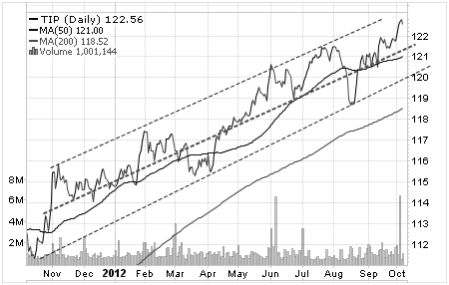
Featured is TIP, the bond fund that is indexed for inflation. The buyers of this fund expect price inflation. The trend is clearly upward bound.
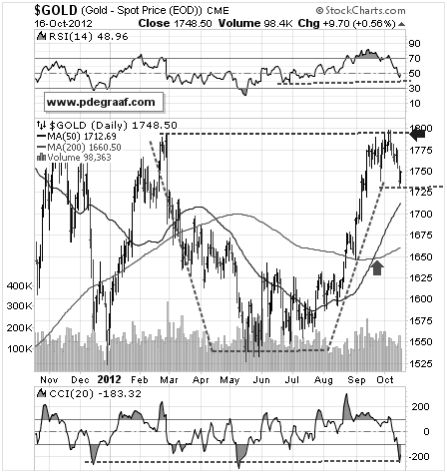
Featured is the daily gold chart. Price is carving out a bullish 'cup with handle' formation. This type of chart formation most often resolves to the upside. The two supporting indicators are back at support levels. The 50DMA is in positive alignment to the 200DMA (green arrow), while both are in rising mode for the first time since we saw a similar pattern (called a 'golden cross'), in early 2009, see next chart. A breakout at the blue arrow will turn the trend bullish again.
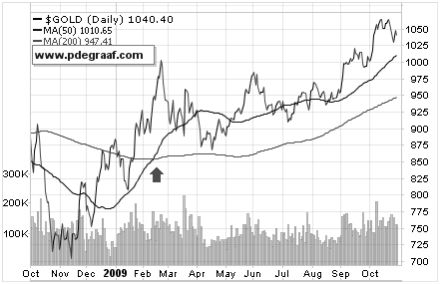
Featured is the 'golden cross' that occurred in gold in early 2009. Gold was trading at $875 at the time.
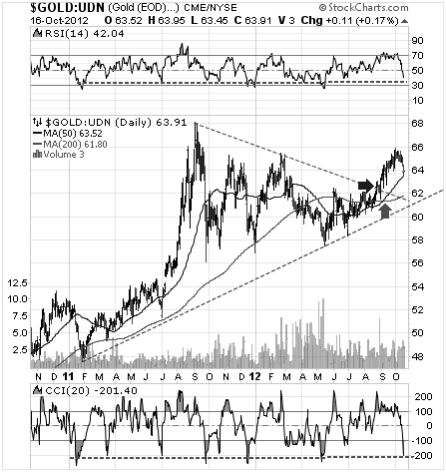
Featured is the gold price in 6 foreign currencies. The breakout at the blue arrow tells us that gold is rising not only in U.S. dollars but also in currencies such as the Euro and the Swiss Franc. The 50DMA is back in positive alignment to the 200DMA (green arrow), while both are in uptrend. The supporting indicators are back at support levels (green lines).
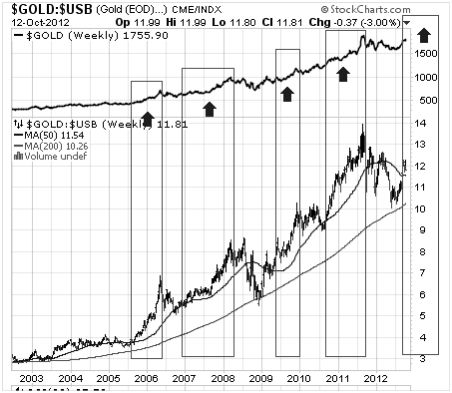
Featured is the index that compares gold to bonds, with the gold price at the top of the chart (black line). Since 2002 gold has outperformed bonds. The green boxes highlight a breakout in the index at the 50D. Notice how each breakout in the index, coincides with a bullish rally in the price of gold. The last time this index rose up from the 200D (in 2009), gold rose from $800 to $1920. (In the event that both long bonds and the US dollar break down simultaneously, the conclusion will be that China is dumping treasuries. An unnamed Chinese official was quoted last week as being unhappy with the way the U.S. administration is handling the dollar).
"Over the course of 600 years, five dynasties in China had implemented paper money and all five had made frequent use of the printing press in an attempt to solve problems. Economic catastrophe and political chaos inevitably followed. Time and time again officials looked to paper money for instant liquidity and the immediate transfer of wealth. But its ostensible virtues could not withstand its tragic legacy; those who held it as a store of value found that in time all they held were worthless pieces of paper." ~ Ralph T. FOSTER - Author of Fiat Paper Money - the History and Evolution of our Currency - P 29.
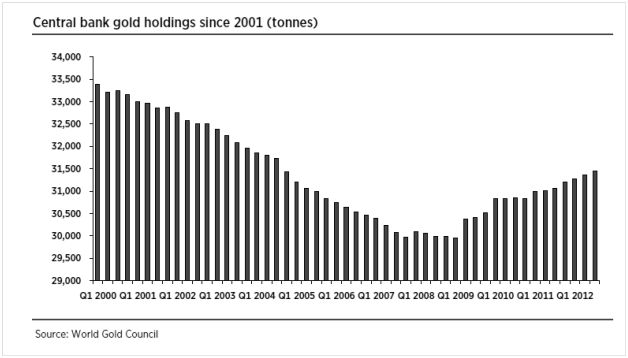
This chart courtesy World Gold Council and Thunder Road Report shows the change in the attitude of Central Banks toward gold. In 2009 the selling of gold turned into the buying of gold and the trend is now upward bound.
Summary: Technical analysis tells us where price has been in the past. Since history repeats, there are a number of patterns that give us a clue where price is headed next. Combined with the study of fundamentals, we can improve the odds in our favor.
Happy trading!
By Peter Degraaf
Peter Degraaf is an on-line stock trader with over 50 years of investing experience. He issues a weekend report on the markets for his many subscribers. For a sample issue send him an E-mail at itiswell@cogeco.net , or visit his website at www.pdegraaf.com where you will find many long-term charts, as well as an interesting collection of Worthwhile Quotes that make for fascinating reading.
© 2012 Copyright Peter Degraaf - All Rights Reserved
DISCLAIMER: Please do your own due diligence. I am NOT responsible for your trading decisions.
Peter Degraaf Archive |
© 2005-2022 http://www.MarketOracle.co.uk - The Market Oracle is a FREE Daily Financial Markets Analysis & Forecasting online publication.


