


Austerity Problems, Fiscal Cliff Perils, U.S. Election it's the Economy Stupid!
Economics / US Economy Oct 24, 2012 - 03:21 AM GMTBy: John_Mauldin

 “Spain is not Greece” – Elena Salgado, Spanish Finance Minister, February 2010
“Portugal is not Greece” – The Economist, April 2010
“Greece is not Ireland” – George Papaconstantinou, Greek Finance Minister, November 2010
“Spain is neither Ireland nor Portugal” – Elena Salgado, Spanish Finance Minister, Nov. 2010
“Ireland is not in ‘Greek Territory’” – Irish Finance Minister Brian Lenihan, November 2010
“Neither Spain nor Portugal is Ireland” – Angel Gurria, Secretary-General OECD, Nov. 2010
“Italy is not Spain” – Ed Parker, Fitch MD, June 12, 2012
“Spain is not Uganda” – Spanish PM Mariano Rajoy, June 2012
“Uganda does not want to be Spain” – Ugandan foreign minister, June 13, 2012
Having been to all the countries listed above, with the exception of Uganda (although I have been to 15 countries in Africa, several bordering Uganda), I am most happy to confirm that they are all different. Just as you would grant me the fact that the US is not the UK and that France is not Argentina. To paraphrase Tolstoy, dysfunctional countries come by their unhappy sets of circumstances in their own individual ways.
How does one go about comparing the financial crisis in one country to that of another? The International Monetary Fund tried to do just that, setting off a rather torrid debate in economic circles. And while we will look today at their analysis, the upshot is that the economic models used to guide monetary and fiscal policy may not be working as they did in the past. Last week in this letter, I postulated a condition I called the Economic Singularity. Just as the singularity at the center of a black hole creates a region where mathematical models break down, a large mass of debt will create its own Economic Singularity where economic models no longer work as expected.
Given that within a few weeks a very large debate will erupt in Congress about how to deal with the “Fiscal Cliff,” with both sides displaying economic models that demonstrate the clear superiority of their chosen solutions and the utter disaster that will ensue if the opposition’s plans are enacted, I think we will find it useful to look at some of the underlying assumptions. Given the fact that almost everyone, including your humble analyst, has concluded that if the tax increases and spending cuts were to be enacted as the legislation currently dictates, a rather serious recession would follow in short order, it might help us to look at some of the assumptions behind that assessment.
In today’s letter we’ll peek over the Fiscal Cliff and see what economic models can tell us about government spending. And if we have time we’ll quickly look at an interesting study that uses economics to predict the outcome of this US presidential election.
At Mauldin Economics we have a laser-like focus on estimating what the economic climate will be in the coming year. As a bit of a preannouncement, I’ll be doing a Post-Election Summit Conference on November 20 with a few of my friends, looking at the likely direction of the economy with the certainty of the presidential and congressional elections behind us. It will be a free seminar, cosponsored by my friends at Real Clear Politics (www.realclearpolitics.com) and available on the Internet to those who register. I’ll give you more details as we get closer, but this is something you won’t want to miss. And now let’s hang our toes out over that Fiscal Cliff.
The chief economist for the International Monetary Fund, Olivier Blanchard, and his associate Daniel Leigh gave us an eye-opening three-page paper, buried in a 250-page World Economic Outlook release last week (http://www.imf.org/external/pubs/ft/weo/2012/02/pdf/text.pdf). They studied an economic concept called the fiscal multiplier, which is usually defined as the change in real GDP that is produced by a shift in fiscal policy equal to 1% of GDP. In simple terms, if the fiscal multiplier is assumed to be 1.0 then a change in government spending by 1% (either an increase or decrease) would produce a corresponding change of 1% of GDP.
Most institutional economists prior to this paper assumed the fiscal multiplier to be about 0.5. Again in simple terms, this would mean that government spending cuts equal to 1% of GDP would reduce actual GDP in the coming year by about 0.5%. The fall in GDP would of course reduce tax revenues, which means that you would have less than a 1% actual cut in the deficit. If the tax rate is 30% in this example, the deficit will be reduced by only 0.85%. That may be an acceptable outcome when an economy is growing nicely or the deficit and total debt are too high and the bond market is forcing the government to cut back.
While Blanchard and Leigh agree that in the past the fiscal multiplier was generally about 0.5%, they suggest that in the recent fiscal crisis the fiscal multiplier has been much higher. Their study suggests that it has been at least 0.9% and perhaps as much as 1.7%. This certainly seems to be the case in Greece and Spain, as their austerity measures appear to be working in reverse.
Gavyn Davies of the Financial Times views the IMF research finding from the perspective of England, where the government is taking 40%. The results are less than pleasing:
“If, however, the multiplier is 1.7, then the same initial public spending cut of 1 per cent of GDP would reduce real output by 1.7 per cent. The second round effects of this reduction in output would reduce tax or raise transfers by 0.68 per cent. The net overall improvement in the budget deficit would therefore be only 0.32 per cent. The economy would be in recession, and the budget deficit would hardly improve at all. Even if this were acceptable to governments, it would not be acceptable for very long to their electorates.
“This pessimistic arithmetic is not that far away from describing what has actually happened in some countries, like the UK, in the past two years. Furthermore, if we take this arithmetic as a given, there is more bad news to come. The major four advanced economies are now all planning to tighten fiscal policy in the years ahead by an average of 1 per cent of GDP per annum.
“…With a fiscal multiplier anywhere near the upper end of the Blanchard/Leigh suggested range, the effects of these policy changes would eliminate any chance of a rebound to normal growth rates in the advanced economies for some time to come. Interestingly, the planned fiscal tightening in the troubled economies of the eurozone is no longer any greater than it is for the major economies, because of the recent relaxation of some budget targets. Even so, it is hard to see how these plans could be sustained if the fiscal multiplier is at the upper end of the possible range.”
But there is a problem with this analysis, as Davies and others point out. It assumes that the results in one country will pretty closely match those in any other country. However, if you take out Greece and Germany, as an example, you pretty much remove the increase in the fiscal multiplier. Not that that would stop Paul Krugman and his fellow Keynesians from trumpeting this analysis as a reason to eschew all forms of austerity. In any case, the research does call attention to the dangers of creating economic models that are used to guide public policy. Davies continues:
“…The decline [in the IMF model of the fiscal multiplier] occurred mainly because economists became much more aware of the need to make assumptions about monetary policy when making the estimates. If the central bank is assumed to hold monetary growth or inflation at a given target rate when fiscal policy is tightened, then interest rates will decline and this will offset some of the negative effects of the fiscal change on output. The multiplier will be lower.
“The opposite is also true. Now that interest rates are stuck at the zero lower bound, central banks cannot reduce policy rates when fiscal policy is tightened, and the multiplier is correspondingly increased.” (emphasis mine)
I have mentioned several times a paper by the powerhouse economic couple Christina and Paul Romer (she was the chairperson of Obama’s Council of Economic Advisers), which showed that the multiplier for tax cuts or tax increases is around 3 in the US. Accordingly, a tax increase or cut equivalent to 1% of GDP should affect the US economy by 3%.
Davies notes that Larry Summers and Brad DeLong have argued that the multiplier should be assumed to be a minimum of 1.0 under present circumstances. [Their work] explains very clearly why the multiplier should be much higher than normal when the economy is stuck in a recession with interest rates at the zero lower bound. Another noteworthy paper, by Auerbach and Gorodnichenko, says that the multiplier during recessions might be around 1.5-2, while in expansions it drops to zero.” Additionally, Robert Barro of Harvard has suggested that the tax multiplier is 1.
In another article, Professor Carlos Vegh of the University of Maryland said lots of evidence suggested that multipliers would differ greatly from country to country; and “the whole exercise of trying to forecast growth for many different countries using essentially a single multiplier, whatever the value may be, is, in and of itself, an exercise in futility”. (FT)
You can pretty much pick a fiscal multiplier that works for your desired outcomes and find an academic study that will support it. And that is the point. Economists want to create models. It is in their DNA (perhaps defectively, I admit). And sometimes they have to make assumptions in order to make the models look like something that might be useful. The problem is that politicians, in particular, don’t look at the underlying assumptions but use the parts of the studies that most closely reflect their particular biases. The IMF report above uses data from many countries that are, indeed – as our quotes at the top suggest – unlike each other. Comparing Greece to Germany and then using that data to suggest policies for Spain and Ireland is a dubious practice. There are just not enough data points for such conclusions to be statistically valid – but that won’t stop the politi cians from using the IMF study if it supports the policy outcome they prefer. The IMF, for what might be very good reasons explained way down in the footnotes, excluded countries such as New Zealand and the Baltics that had better outcomes from austerity policies. Their inclusion would alter the study.
The Perils of the Fiscal Cliff
In the third quarter of 2011 the US Congress agreed to rather severe tax increases and spending cuts that would kick in as of January 2013, as a way to get a deal done to increase the debt ceiling. In addition, the Social Security payroll tax cut and extended unemployment benefits are also scheduled to go away in January. All told, if nothing changes, this abrupt shift in fiscal policy would result in a hit to the economy of about $650 billion, or a little more than 4% of GDP, at a time when the economy is likely growing less than 2% a year.
Let me break down the major components of the Fiscal Cliff:
- Abolition of the Bush tax cuts, which amount to $265 billion, of which $55 billion is for the “wealthy” and $210 billion for the “middle class” (everyone else). Almost no one on either side of the aisle wants to actually go forward with axing the tax cuts for the middle class. Republicans want to hold on to the top-level tax cuts, and to my mind that’s a bargaining chip (see below).
- The Budget Control Act, or the debt-ceiling deal, comes in at roughly $160 billion, with $110 billion of that in sequestration, mostly for defense; and there seems to be a growing consensus that not all of these cuts should be made.
- The 2009 stimulus will also roll off (this is the 2% Social Security break and extended unemployment benefits). This amounts to $140 billion all on its own, or almost 1% of GDP. Almost everyone agrees that these tax cuts were supposed to be temporary.
- The “ObamaCare” $24-billion tax increase on high-income households is almost sure to be allowed to go through.
- Technically, there is $105 billion in the temporary “doc fix” and Alternative Minimum Tax, which every year are supposed to expire and every year are postponed, which of course allows Congress and the president (whoever is in control) to project lower deficits in the future, even though those cuts never happen.
If you add the $105 billion of fixes in #5 and the middle class tax cuts, you get $315 billion, or almost half of the Fiscal Cliff, which reduces the impact to 2% of GDP. Take some of the sting out of defense and you get to less than 0.5%.
But this creates a big but… What is your fiscal multiplier? It is not so simple as looking at what the IMF manufactures as a number and then extrapolating. Without trying to be cute, the US is not Greece or Spain or Germany; we are perfectly capable of creating our own unique brand of chaos. It is all debt-related to be sure, but the similarities begin to break down when you look at the gory details.
Not all tax increases or tax cuts have the same multiplier, just as not all spending increases or spending cuts do. There is a big difference, as Gavyn Davies pointed out, between a fiscal multiplier of 0.5 and one of 1.7. Before we get into what our multiplier might be, let’s review a few facts.
There is a rule in economics: If something can’t happen, it won’t. That may seem a tad obvious, but so many people are prone to think that the current trend can go on forever. This time is different, we tell ourselves. Meanwhile I and many others – David Walker, David Stockman, Alan Simpson, David Bowles, et al. – are telling you that so much of what we’re doing is unsustainable that big changes in present trends, as much as we might not like to think about them, are inevitable. So what we must think about now is what will happen when major change is either forced on a country or else entered into willingly. Sometimes you have to think the unthinkable.
Look at the projected debt for the US, compiled by the Heritage Foundation, based on realistic assumptions, not compiled while wearing rose-colored glasses. This is a chart of something that will not happen. Long before we get ten years of multi-trillion-dollar debt, the bond market will begin to demand much higher rates than we currently experience, driving up our interest-rate cost as a percentage of tax revenues to very painful levels, forcing cuts in all sorts of things we currently think of as absolutely necessary – like the military, education, and Medicare spending.
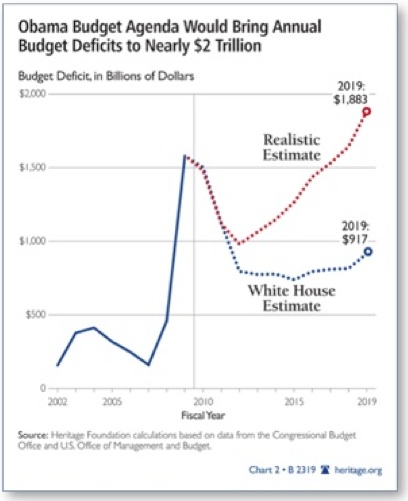
One way or another, the projected budget deficits – whether the one from the Heritage Foundation or the official government projection – are going to come down. We can choose to proactively deal with the deficit problem or we can wait until there is a crisis and be forced to react. These choices will result in entirely different outcomes.
In the US, the real question we must ask ourselves as a nation is, “How much health care do we want and how do we want to pay for it?” Everything else can be dealt with if we get that basic question answered. We can substantially change health care, along with other discretionary budget items, or we can raise taxes, or some combination. Each path has consequences.
The polls say a large, bipartisan majority of people want to maintain Medicare and other health programs (perhaps reformed), and yet a large bipartisan majority does not want a tax increase. We can’t have it both ways, which means there is a major job of education to be done. But that is also why politicians seem to be advocating both objectives – their first order of business is to make sure they get re-elected.
The point of the exercise, to my mind, is to reduce the deficit over 5-6 years to some sustainable level below the growth rate of nominal GDP (which includes inflation). A country can run a deficit below that rate forever, without endangering its economic survival. While it may be wiser to run some surpluses and pay down debt, if you keep your fiscal deficits lower than income growth, over time the debt becomes less of an issue.
Either raising taxes or cutting spending has side effects that cannot be ignored. Either one or both will make it more difficult for the economy to grow. As a reminder to long-time readers and a quick intro to new readers, let’s quickly look at a basic economic equation:
GDP = C + I + G + Net Exports, or GDP is equal to Consumption (Consumer and Business) + Investment + Government Spending + Net Exports (Exports – Imports). This is true for all times and countries.
Now, what typically happens in a business-cycle recession, as businesses produce too many goods and start to cut back, is that consumption falls; and the Keynesian response is to increase government spending in order to assist the economy to start buying and spending. The theory is that when the economy recovers you can reduce government spending as a percentage of the economy and pay down the borrowed debt – except that has not happened for a long, long time. Government spending has just kept going up for decades. Sometimes taxes would rise faster than spending, as during the all-too-brief Clinton-Gingrich years. In response to the Great Recession, government (both parties) increased spending massively. And it did have an effect. But it wasn’t just the stimulus, it was the absolute size of government relative to GDP that increased as well.
And now massive deficits are projected for a very long time, unless we make major changes. The problem is that taking away that deficit spending is going to have the reverse effect of the stimulus – a negative stimulus, if you will. Why? Because the economy is not growing fast enough to overcome the loss of that stimulus. We will notice it. It is the “G” component of the above equation, which was first developed by Irving Fisher during the Great Depression. The negative stimulus should be a short-term effect –most economists agree it will last 4-5 quarters – and then the economy may be better, with lower deficits and smaller government.
In order to get the deficit under control, we are talking about reducing the deficit on the order of 1% of GDP every year for 5-6 years. That is a very large headwind on growth, especially in a 2% Muddle Through economy. GDP for the US is now on an anemic 2% growth trend, with very weak final demand. Think what it would be if the full anticipated 2% of spending cuts and tax increases were put into force. It would be very hard to attain positive growth in 2013.
Furthermore, tax increases reduce GDP by anywhere from 1 to 3 times the size of the increase, depending on which academic study you favor. Large tax increases will inevitably reduce GDP and potential GDP. That may be the price we want to pay as a country, but we need to recognize that there will be a cost to growth and employment. Those who argue that taking away the Bush tax cuts will have no effect on the economy are simply not dealing with the facts, based on well-established research. Now, that is different from the argument that says we should allow the cuts to expire anyway.
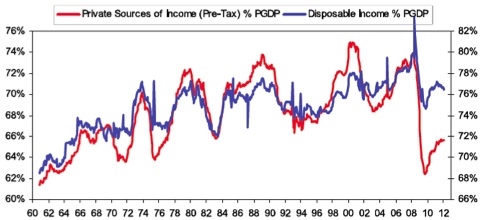
Those who argue that reducing spending will also have an effect are equally correct. Government has been a large contributor to consumer income and therefore personal consumption, part of the “C” in the above equation (along with business consumption). The chart below, produced by Bridgewater last April, shows the additional effect of government spending on disposable income for the US consumer. Notice that without government support, disposable income would now be significantly lower. Letting the “one-time” Social Security stimulus (which has already been extended for two years) go away, along with extended unemployment benefits, will result in a decline in GDP of almost 1% and the loss of a significant contribution to disposable income.
There are no easy choices. If we do nothing about the deficit, we will quickly find ourselves close to the black hole of too much debt. Yet, trying to do too much too quickly will bring the economy perilously close to recession, which will mean increased government expenses and decreased revenues, making it hard to balance the budget. Forget Greece and Spain; ask the United Kingdom how well their austerity efforts are doing. This is a country making a serious and credible attempt to reduce their deficits, and sadly, they have fallen back into recession.
No matter what economists with their models and politicians with their agendas will try to tell you, there is no “easy button.” While there may be a correct path to reducing the deficit and keeping us out of recession, that path is not going to be clear from the models. What we will hopefully do is get the direction correct and ease slowly into confronting the deficit-reduction facts. My thought is that if there are going to be tax increases and spending cuts, they should be phased in quarter by quarter. It might be better to simply hold the line on spending on all but essential items, cutting spending where possible to allow for spending growth in areas like health care. The bond market will behave as long as Congress defines a very clear and credible path to a manageable deficit.
Both Republicans and Democrats will have to compromise. This election is primarily about the direction of the compromise. It is my sincere hope that both parties do not waste this crisis. There will be no better time to engage in comprehensive tax reform than the first six months of next year. True tax reform could actually be a significant stimulus to the economy and partially offset the drag of reducing the deficit. Tax reform in combination with a serious energy policy that encourages more rapid expansion of domestic production, plus control of health-care expenditures, will let us reduce the “fiscal multiplier” – especially important, given that monetary policy is severely constrained with interest rates at the zero bound.
Finding the right policy mix will be difficult. There has to be deficit reduction each and every year, to be credible, but not so much as to push the economy into recession. Frankly, we will be lucky to find that right mix, given the nature of the political process. Whatever happens, each party will blame the other when there are problems and take credit when there are successes. That is the nature of the political beast.
From an investment standpoint, the fact that earnings are coming out much weaker so for this earnings season does not bode well for the future. Apart from ephemeral enthusiasm from time to time, volatility will be the rule of the day – even more so than in the past few years. The risk of a “tail event” will increase, given the very real possibilities of exogenous shocks from Europe and Japan. This is not a time to be casual or to think that recent past performance in the equity markets is indicative of future results. This is a theme that we will be returning to often over the next few months.
Economic Indicators for the Election – It’s the Economy, Stupid!
My focus in Thoughts from the Frontline is to comment on macroeconomic and investment issues. I try to venture into the political arena only with regard to the prospects for the economy and investments, rather than blatantly espousing my political views (which long-time readers can discern in any case).
That being said, I ran across a very interesting presidential election forecasting methodology based on economics and not on polls. Ken Bickers and Michael Berry, professors of political science at the University of Colorado Boulder and the University of Colorado Denver, respectively, built a model based on the economics of each individual state and how it has voted since 1980. Their model has “predicted” with reasonable accuracy the winner of every presidential election since 1980. The model includes economic data from all 50 states and the District of Columbia, incorporating both state and national unemployment figures as well as changes in real per-capita income, among other factors. This feeds right into James Carville’s famous line in 1992 (as the campaign director for Clinton): “It’s the economy, stupid!”
My personal political guess is that what the authors are actually modeling are the independent voters in the various states. Single-issue voters on social issues find reasons to override their economic interests and tend to dominate primary-season politics, so while the final November election result may be interpreted as a referendum on social issues, it more likely to resemble Carville’s world, at least if the professors’ analysis is right. I offer their work (and a link, below, to 12 other models) as a different way to look at the election 15 days from now.
According to their Bickers and Berry’s analysis, Romney is projected to receive 330 of the total 538 Electoral College votes. President Obama is expected to receive 208 votes – down five votes from their initial prediction and well short of the 270 needed to win. The focus of their study is on state-level economic stress. I think the approach of using economic-stress models to predict election outcomes is a very interesting one. Their model was within five electoral votes in Obama’s 2008 trouncing of McCain.
In addition to state and national unemployment rates, the authors analyzed changes in personal income since the prior presidential election. Research shows that these two factors, unemployment and income, affect the major parties differently: voters hold Democrats more responsible for unemployment rates, while Republicans are held more responsible for fluctuations in personal income. Accordingly – and depending largely on which party is in the White House at the time – either factor can either help or hurt the major parties disproportionately.
The authors also provided caveats. Their model had an average error rate of five states and 28 Electoral College votes. Factors they said might affect their prediction include the timeframe of the economic data used in the study and the fact that states very close to a 50-50 split might fall in an unexpected direction due to factors not included in the model. Right now their study is an interesting curiosity, but if it is as close to right this time as it has been in some past elections, it might have a serious impact on future campaigns. You can see the full report and their data at http://www.colorado.edu/news/releases/2012/10/04/updated-election-forecasting-model-still-points-romney-win-university.
I should note that PS: Political Science & Politics, a peer-reviewed journal of the American Political Science Association, has published collections of presidential election models every four years since 1996, but this year the 13 featured models showed the widest split ever in outcomes. Five predict an Obama win, five forecast a Romney win, and three rate the 2012 race as a toss-up. As with economic models and austerity programs, you can find something that makes the case for your favorite candidate. Serious data wonks and political junkies (I am both, so doubly cursed) can revel in all 13 models at http://journals.cambridge.org/action/displayJournal?jid=PSC.
Brazil, Uruguay, Argentina, Chicago, New York, and North Dakota
I leave next Sunday for Brazil, Uruguay, and Argentina for almost two weeks, where I will be with my South American partner, Enrique Fynn of Fynn Investments (based in Uruguay). But I get to take almost a week off to go to Cafayete, Argentina, where my friends at Casey Research have developed a wonderful resort in the northern Argentina wine country. Lots of good friends, great conversation, and a laid-back life await me, and I hope to get in some rest and relaxation as well as get a few books read. I will check back in Tuesday night, when I will be watching the election results into what will probably be the early hours of the morning – I doubt this election will be called as quickly as the last one. And of course I will be writing this letter.
When I get back I’ll head to Chicago for a day to be with my partners at the Schwab Impact conference. Then it’s on to New York for the Post Election Summit Conference I mentioned. The day after Thanksgiving I will head up to what may already be a very cold North Dakota to speak at a conference and tour the Bakken oil and gas region. And then it’s back to New York for the annual Festivus party (and fund-raiser), hosted by Todd Harrison and my friends at Minyanville.
It really is time to hit the send button. For a variety of reasons, some perfectly reasonable and some not so much, this is the latest I have ever hit the send button in 13 years. It is Monday evening and time to go eat sushi with the kids, as Abbi and her fiancé are in town from Tulsa and will have one last evening with Dad and some siblings before heading back tonight. I will work harder at getting this letter out on time, on my new schedule.
I would be remiss without mentioning the passing of an old friend. Big Tex was 60 years old and 52 feet tall. He was an iconic statue at the State Fair of Texas, welcoming the millions as they came through the entrance with his trademark greeting: “Howdy, folks this is Big Tex. Welcome to the great State Fair of Texas.” In what was probably an electrical fire, his clothing burned in less than ten minutes. Big Tex had been my fair buddy from early childhood. If kids (or parents) got lost in the day before cell phones, they met back up at his feet. Every little kid knew where Big Tex was. Ten minutes, and a lifetime of memories up in smoke.
I assume they will build another newer and better Big Tex, with more up-to-date electronics and motion and all that. But for some of us, that large voice and frozen smile was the symbol of good times and bad (for you) fried food. That corn dog eaten in the shadow of Big Tex will always linger in the memories of more than a few of us here in Texas.
Have a great week. This will be a fast one for me, as there is so much to get done before I head for parts south.
John Mauldin, Editor
Outside the Box
JohnMauldin@2000wave.com
By John F. Mauldin
Outside the Box is a free weekly economic e-letter by best-selling author and renowned financial expert, John Mauldin. You can learn more and get your free subscription by visiting www.JohnMauldin.com.
Please write to johnmauldin@2000wave.com to inform us of any reproductions, including when and where copy will be reproduced. You must keep the letter intact, from introduction to disclaimers. If you would like to quote brief portions only, please reference www.JohnMauldin.com.
John Mauldin, Best-Selling author and recognized financial expert, is also editor of the free Thoughts From the Frontline that goes to over 1 million readers each week. For more information on John or his FREE weekly economic letter go to: http://www.frontlinethoughts.com/
To subscribe to John Mauldin's E-Letter please click here:http://www.frontlinethoughts.com/subscribe.asp
Copyright 2012 John Mauldin. All Rights Reserved
Note: John Mauldin is the President of Millennium Wave Advisors, LLC (MWA), which is an investment advisory firm registered with multiple states. John Mauldin is a registered representative of Millennium Wave Securities, LLC, (MWS), an FINRA registered broker-dealer. MWS is also a Commodity Pool Operator (CPO) and a Commodity Trading Advisor (CTA) registered with the CFTC, as well as an Introducing Broker (IB). Millennium Wave Investments is a dba of MWA LLC and MWS LLC. Millennium Wave Investments cooperates in the consulting on and marketing of private investment offerings with other independent firms such as Altegris Investments; Absolute Return Partners, LLP; Plexus Asset Management; Fynn Capital; and Nicola Wealth Management. Funds recommended by Mauldin may pay a portion of their fees to these independent firms, who will share 1/3 of those fees with MWS and thus with Mauldin. Any views expressed herein are provided for information purposes only and should not be construed in any way as an offer, an endorsement, or inducement to invest with any CTA, fund, or program mentioned here or elsewhere. Before seeking any advisor's services or making an investment in a fund, investors must read and examine thoroughly the respective disclosure document or offering memorandum. Since these firms and Mauldin receive fees from the funds they recommend/market, they only recommend/market products with which they have been able to negotiate fee arrangements.
Opinions expressed in these reports may change without prior notice. John Mauldin and/or the staffs at Millennium Wave Advisors, LLC and InvestorsInsight Publishing, Inc. ("InvestorsInsight") may or may not have investments in any funds cited above.
Disclaimer PAST RESULTS ARE NOT INDICATIVE OF FUTURE RESULTS. THERE IS RISK OF LOSS AS WELL AS THE OPPORTUNITY FOR GAIN WHEN INVESTING IN MANAGED FUNDS. WHEN CONSIDERING ALTERNATIVE INVESTMENTS, INCLUDING HEDGE FUNDS, YOU SHOULD CONSIDER VARIOUS RISKS INCLUDING THE FACT THAT SOME PRODUCTS: OFTEN ENGAGE IN LEVERAGING AND OTHER SPECULATIVE INVESTMENT PRACTICES THAT MAY INCREASE THE RISK OF INVESTMENT LOSS, CAN BE ILLIQUID, ARE NOT REQUIRED TO PROVIDE PERIODIC PRICING OR VALUATION INFORMATION TO INVESTORS, MAY INVOLVE COMPLEX TAX STRUCTURES AND DELAYS IN DISTRIBUTING IMPORTANT TAX INFORMATION, ARE NOT SUBJECT TO THE SAME REGULATORY REQUIREMENTS AS MUTUAL FUNDS, OFTEN CHARGE HIGH FEES, AND IN MANY CASES THE UNDERLYING INVESTMENTS ARE NOT TRANSPARENT AND ARE KNOWN ONLY TO THE INVESTMENT MANAGER.
John Mauldin Archive |
© 2005-2022 http://www.MarketOracle.co.uk - The Market Oracle is a FREE Daily Financial Markets Analysis & Forecasting online publication.