


Moving Averages and the Elliott Wave Principle
InvestorEducation / Elliott Wave Theory Nov 02, 2012 - 01:03 PM GMTBy: EWI

 Moving averages are one of the most widely-used methods of technical analysis because they are simple to use, and they work. Among Elliott wave traders, you will likely find an especially high percentage of investors and traders who incorporate moving averages into their Wave analysis.
Here's why: you can use moving averages to identify Elliott waves.
Senior Analyst Jeffrey Kennedy knows how to take complex trading methods and teach them in a way you can immediately understand and apply -- his step-by-step tutorials are beneficial to traders at any level of experience. Jeffrey is also well-known for combining ancillary technical tools to strengthen his Elliott wave analysis.
The following lesson provides a powerful example of how moving averages can strengthen your ability to identify Elliott Patterns. It is excerpted from Jeffrey's free 10-page eBook, How You Can Find High-Probability Trading Opportunities Using Moving Averages. (Click here to get your copy of this free eBook now.)
If you're new to the Wave Principle, I recommend using a moving average to get you started, and the reason why is that a moving average overlaid on a price chart will help train your eye to see developing Elliott wave patterns.
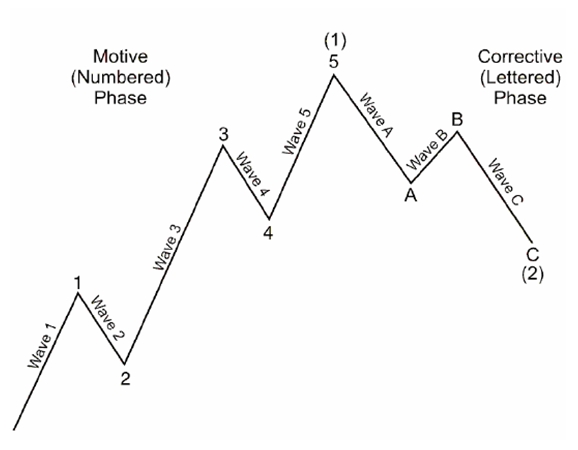
For an example of a schematic Elliott wave, look at the figure below:
If you've read The Elliott Wave Principle by Robert Prechter and A.J. Frost, you know that wave patterns are illustrated as line diagrams.
When you look at a real price chart rather than a schematic, the basic chart is typically an open-high-low-close price chart. Each price bar represents a single period and is illustrated by a vertical line with a small mark to the left and a small mark to the right as seen in the next figure:
The little lower line on the left-hand side of the vertical bar is the open; the little upper line on the right-hand side of the vertical line is the close; the top of the line is the day's high or that trading period's extreme; and the bottom of the line is that trading period's low.
Here's the thing: Whenever you're making the transition from looking at a textbook diagram to actually counting Elliott waves on a real price chart, it can be confusing to the eye. If you use a moving average, it will help you to see the wave pattern more easily.
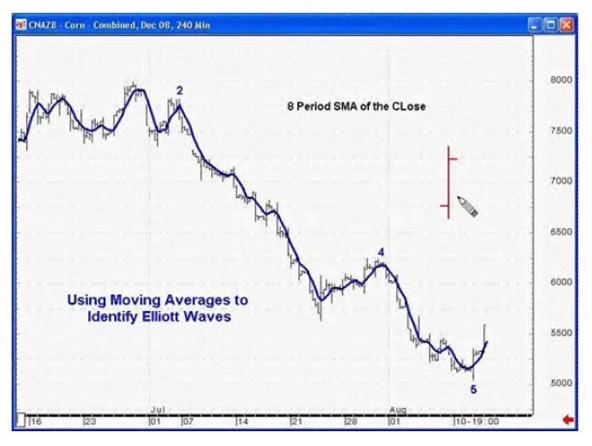
Let me prove my case more thoroughly with this chart of Corn:
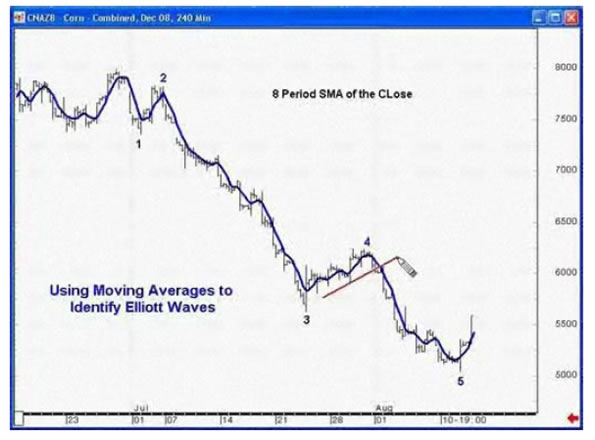
The blue line is an 8-period simple moving average of the close, which clearly shows that a five-wave decline has unfolded from the upper left-hand side of this price chart. With the aid of a moving average, the subdivisions within this selloff are more easily discernible than with the untrained naked eye.
Also, notice that the slope of the move up in wave 4 is shallow. This detail is important because one of the key characteristics of countertrend price action is that it moves slowly, thus its slope will be inherently more shallow than what one can expect to encounter when a motive wave is in force.
|
Learn How to Trade the Highest Probability Opportunities: Moving Averages No matter what your level of experience in the markets, you'll be amazed at how quickly you can benefit when you include moving averages in your Elliott wave analysis. Now you can learn how to apply them to your trading and investing in this free 10-page eBook. Learn step-by-step how moving averages can help you find high-probability trading opportunities. Begin to improve your trading and investing with Moving Averages today! Download Your Free eBook Now >> |

This article was syndicated by Elliott Wave International and was originally published under the headline Moving Averages and the Wave Principle. EWI is the world's largest market forecasting firm. Its staff of full-time analysts led by Chartered Market Technician Robert Prechter provides 24-hour-a-day market analysis to institutional and private investors around the world.
About the Publisher, Elliott Wave International
Founded in 1979 by Robert R. Prechter Jr., Elliott Wave International (EWI) is the world's largest market forecasting firm. Its staff of full-time analysts provides 24-hour-a-day market analysis to institutional and private investors around the world.
© 2005-2022 http://www.MarketOracle.co.uk - The Market Oracle is a FREE Daily Financial Markets Analysis & Forecasting online publication.