Gold And Silver – Market Says Wait
Commodities / Gold and Silver 2012 Nov 18, 2012 - 12:53 PM GMTBy: Michael_Noonan
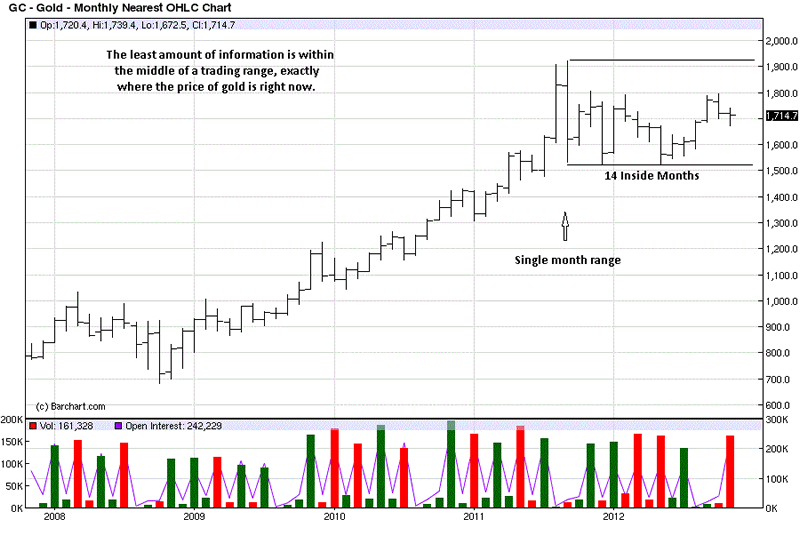
 There is a reason why it has not been easy to trade gold or silver, of late. One area where information is least reliable is in the middle of a trading range. That is precisely where the price of gold is currently, on the larger monthly time frame. However, while waiting idly until clarity re-enters the picture, we can do some stage-setting in preparation for what is to come, in either direction.
Gathering facts is the best way to avoid guessing what to do. We are of the mind that it is best to follow the market’s lead, rather than lead the market in the hopes that it will see the [often questionable] wisdom of divining the future. Most people prefer a “story” that seems to make sense in order to draw an easier conclusion on what to do. Letter writers work that way, markets do not. Consequently, we adhere strictly to the message of the market, for it is never wrong, it just is.
In deference to those who like a good story, there is a battle going on between the evil forces of central banks, hell-bent on destroying currencies, nations, markets and private wealth through the now unreigned creation of infinite fiat, and the other evil forces of central banks, [a duel evil role], hell-bent on refusing to admit gold and silver have a value far greater than any paper counterparts, and doing everything possible to suppress the prices of both metals.
The problem for central banks in running their massive Ponzi scheme is that it becomes more and more difficult to cover-up the fact that [most] all the gold within their control has been given up, in the form of margin, to back up their failed fiat monetary system. The moneychangers are getting caught with their hand in the [mostly empty] till. That is the short-hand version of what is going on.
We see evidence of it in the charts. After a precipitous drop from September 2011 highs to September 2011 lows, all in one month, there has been no further downside follow-through. Instead, what we see is 14 months of sideways movement. The world banking cartel are successfully suppressing price from rising above 1800, but in recognition of the destructive forces of the cartel, the other factions that refuse to drink the fiat kool-aid are supporting gold, around 1500+. Go East, young man, go East!
One thing we know for sure is that the artificial suppression of any market exacerbates the inevitable rise, once that pressure is released. This is our “story” behind the monthly chart. The inability to drive price lower, after 14 months of trying, makes that corrective effort a weak one. It is a market fact that weak corrections lead to higher prices, so the clock it ticking, but it has more time to run. We have no idea how much more? All one can do is see the signs and prepare.
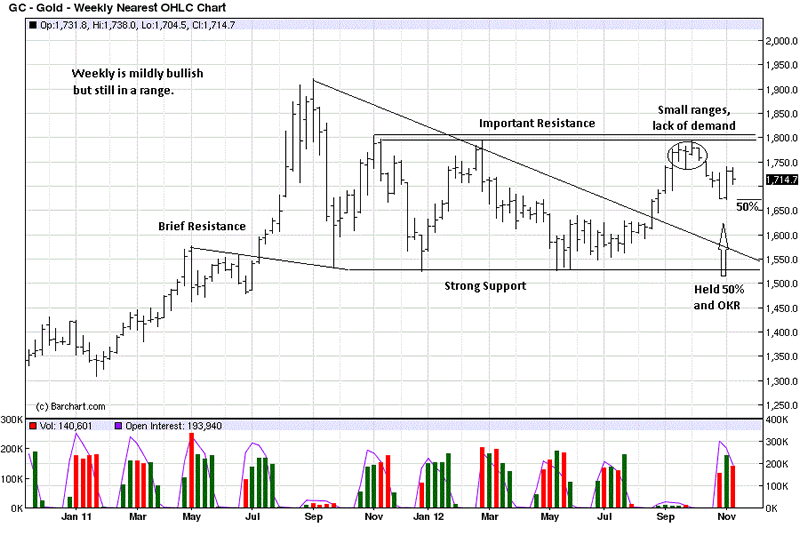
Neither the monthly nor the weekly are timing tools; rather, they form the backdrop for using smaller time frames for entry. Within the confines of a trading range, how it is unfolding has a more positive look about it. Support at the 1500 level has been solid, while the resistance appears to be under more of an assault. Instead of reacting immediately away from the 1800 area, two weeks ago, as gold did on the two previous failed rally attempts, price lingered just under that area. We know from the narrowing of ranges that demand was not strong, and a correction could occur, which one has, as of last week. The character of the correction been unimpressive.
The sell-off of three weeks ago stopped on a dime, and an Outside Key Reversal, OKR, immediately followed. [OKR = an abrupt turnaround in price behavior. In this instance, a lower low, higher high, and a higher close than the previous bar, and the strength of the OKR is seen by the FACT that the close on that bar was above the high of the previous bar.] From this observation, we can conclude that buyers overwhelmed sellers and drove price higher with relative ease.
One added point: the correction stopped at a half-way retracement of the previous swing from low to high. In general, when price holds above a 50% level, it is an indication of strength, otherwise, price would have gone lower. To have these two indicators be positive within the middle of a trading range needs to be heeded.
As an aside, we drew a slanting trendline from the high to the second failed high, and one
can say the trendline was broken, that must be good. Well, one could have drawn a trendline at the previous failed top. It, too, was broken, but to no lasting effect. What is more important is where price fails, in a rally, for it tells us precisely where the last point of resistance was. You can see the lasting effect of the first failed rally from a year ago, November, depicted by the horizontal line that has had a lasting impact. Be wary of trendlines as support/resistance.
It goes without saying that both gold and silver, and maybe silver more than gold, should be accumulated at any price, for the physical, to be held within one’s own control, and NOT within any institution, and NOT in the form of paper certificates. If you do not hold it yourself, you may never get an opportunity to hold it in the future.
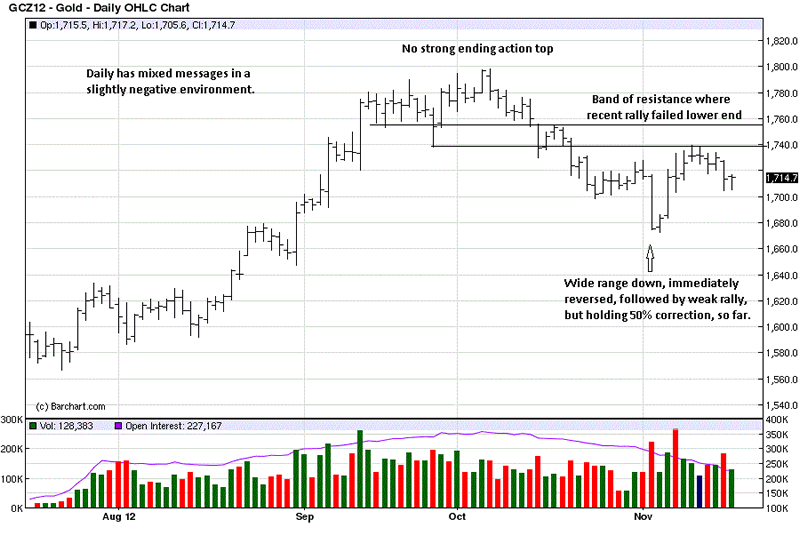
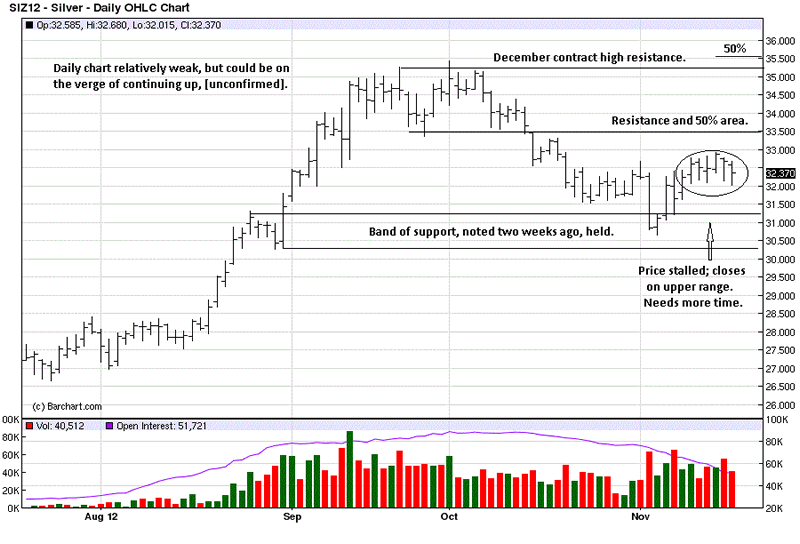
As to the futures market, we still see no reason to buy, based on price location in the two higher time frames, just covered. The daily chart is more illustrative of why not. There are mixed messages, currently. Looking at the recent high: there is no specific ending activity that precludes price from going higher. The subsequent move lower has been gradual, and when there was one burst of downside selling activity, it was quickly erased in two days.
Still, you can see the band of resistance that must be overcome. We did not express the chart comment very clearly in stating the weak rally was holding 50%. It is holding under a 50% retracement to the upside, and that would be a general sign of weakness. One should not be buying weakness, at least until it has been proven to have stopped.
Sometimes, a look at intra day time frames can help bring a clearer picture to developing market activity, but even the 60 minute chart shows no strong selling in the gradual drift lower. We see this as an absence of demand, [buyers] for now, with supply, [sellers] not being able to take advantage of the weak demand.
Keep buying the physical; keep holding off on the futures.
Mention has been made that silver is weaker, relative to gold, and a comparison of the charts shows it to be true. When in a trading range, the level of knowledge remains low because price can rally or decline within those bounds and there is no edge to be had.
Once price breaks out, then there is reason to make a commitment. We have a slight bias to an upside breakout, eventually, but in a trading environment where anything can happen, and often does, it is nothing more than an observation, without acting on it.
Let us then deal with the known facts. Within its trading range, price remains under the 50% area, a general indication of weakness, [reference to the upper 50% noted]. While Bernard Baruch can advise to “buy straw hats in January,” buying too early in futures can prove financially fatal. Just ask Richard Dennis about buying sugar under 5 cents. How much can you lose? Turns out, he lost a fortune. The point? Weakness is mostly a siren call, filled with potential peril.
Right above the 50% resistance area is a potentially stronger resistance, from where the large, wide-range sell-off began in September, 2011. Sellers very often defend the area where they went short, in a big way, so keep an eye on that level.
The lower 50% reference is to the smaller rally from the last low to current swing high. On the correction, price held above the half-way retracement, so it is just a general observation for potential relative strength.
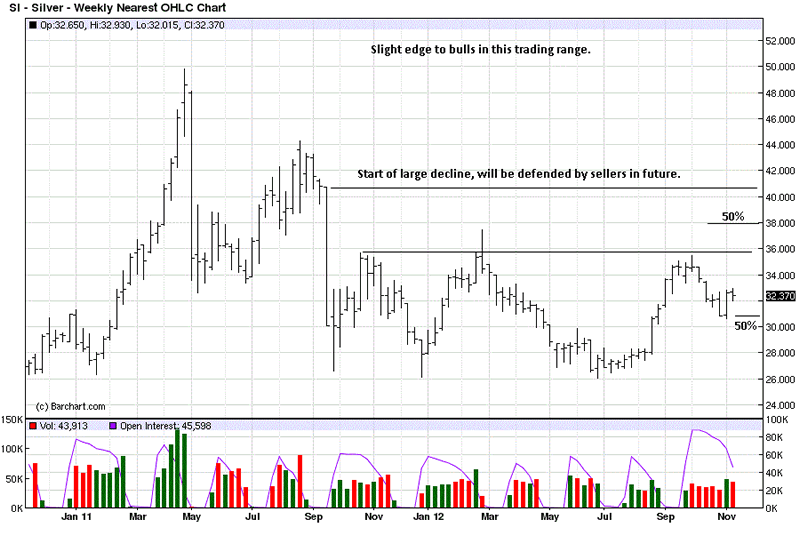
We noted that band of support, two weeks ago when price closed on that wide range bar. It is also at the 50% area just mentioned, above, and it adds to our admitted bias of favoring an eventual upside breakout. However, until there is demonstrated market activity to confirm strength, silver remains in a relatively weak position. That can change in a day, next week, or next month, but until it does, there is no edge in taking a long position, given what is known, at this point.
Buy and hold physical silver with impunity. There is a legitimate shortage, among even stronger reasons for buying and holding. For the futures, it can be just as important to know when NOT to buy as to know when to buy. Based on the charts, now aint’t the time.
By Michael Noonan
Michael Noonan, mn@edgetraderplus.com, is a Chicago-based trader with over 30 years in the business. His sole approach to analysis is derived from developing market pattern behavior, found in the form of Price, Volume, and Time, and it is generated from the best source possible, the market itself.
© 2012 Copyright Michael Noonan - All Rights Reserved Disclaimer: The above is a matter of opinion provided for general information purposes only and is not intended as investment advice. Information and analysis above are derived from sources and utilising methods believed to be reliable, but we cannot accept responsibility for any losses you may incur as a result of this analysis. Individuals should consult with their personal financial advisors.
© 2005-2022 http://www.MarketOracle.co.uk - The Market Oracle is a FREE Daily Financial Markets Analysis & Forecasting online publication.


