


What the Stock Market VIX is Saying About the Fiscal Cliff
Stock-Markets / Stock Markets 2012 Dec 07, 2012 - 09:24 AM GMTBy: J_W_Jones

 The past few weeks have been full of a constant barrage of press conferences and public statements from the charlatans in Washington D.C. Politicians cannot pass up a chance to get in front of the cameras and the media has used the “fiscal cliff” as a mechanism to scare average Americans further about their future.
Interestingly enough, amid all of the nonsense that has been going on stocks have remained resilient. I think sometimes its important to just step back away from the media's noise and just look at some price charts for more clarity. The S&P 500 Index has been trading in a relatively tight range now for over 6 trading sessions as shown below.
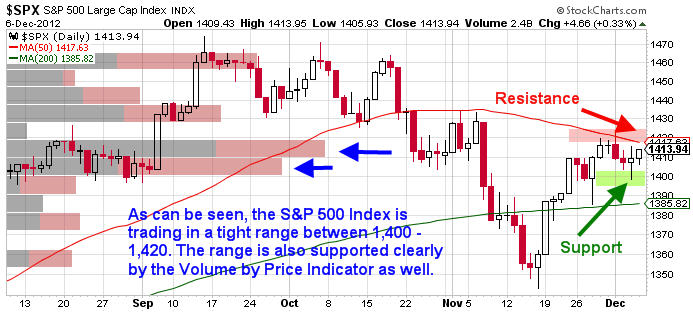
As can be seen above, the S&P 500 is struggling to breakout of the 1,400 – 1,420 price range. It is not mere coincidence that the Volume by Price indicator is illustrating the most trading volume having occurred in and around that price range. So what does the recent action mean in light of the supposedly pending fiscal calamity?
Everyone that is looking for this monster move when the announcement is finally made may be waiting for a while. It is without question that the broader marketplace is clearly aware of the fiscal cliff. It would make sense that Mr. Market may have priced in some of the uncertainty. Furthermore, if there was significant concern we would be seeing prices starting to sell off by now.
Markets do not like uncertainty. However, what is certain is that during the end of the year the bulls usually have the upper hand. The reasons are fairly simple, but they usually hold sway most years. Due to the holiday season, many traders take vacations and leave their trading desks. Because traders are largely absent, volume levels start to decline as the holiday season approaches. Typically volume levels do not normalize until January of the new year.
Low volume levels typically synch up with low volatility levels. When those two forces align together the bulls will almost always have the upper hand. Is it any wonder that this time of year the financial media begins discussing a “Santa Claus rally”? Of course not, but Santa Claus is really just light volume levels and low volatility levels in this case.
Recently volatility has been pretty choppy, but the Volatility Index is not showing considerable fear regarding the fiscal cliff in the near term. In fact, the VIX is trading in the middle of its recent range as shown below.
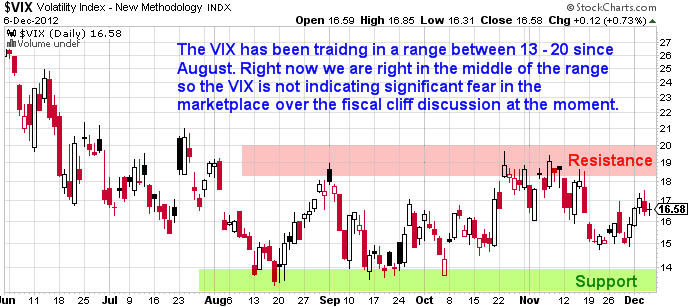
At first glance, this chart does not appear to be warning us about fear at the moment. However, certain aspects of the Volatility Index (VIX) are largely unknown to the retail investor. The VIX is a guide for volatility in the present, but it does a poor job of projecting future volatility. Simply looking at the VIX's current price is not the appropriate way to gauge market volatility expectations in the future..
The Volatility Term Structure is a better way of understanding what the Volatility Index is saying about the future. Wikipedia lists the following definition for volatility term structure:
“Volatility term structures list the relationship between implied volatilities and time to expiration. The term structures provide another method for traders to gauge cheap or expensive options.”
The current Volatility Term Structure chart is shown below courtesy of www.cboe.com:
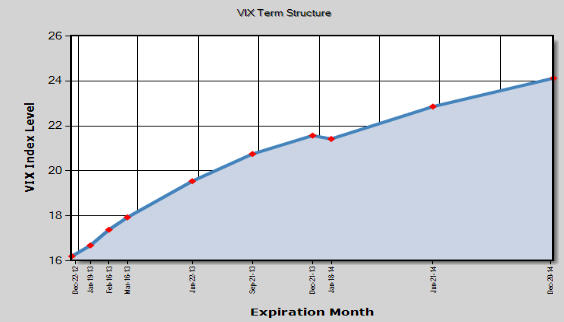
As can be seen above, the forward Volatility Term Structure indicates that volatility is expected to go higher in the future. This is not all that uncommon, but I think what is more important is the rate of change in the near term.
When we look at this chart, the term structure indicates that Volatility levels roughly 4 months out (March 2013) are nearly 13% higher than they are today. By June of 2013, volatility's rate of change is well over 20% higher than it is today.
It is important to understand that volatility does not necessarily mean risk. Volatility typically increases when equity prices are falling, however volatility levels can rise for a variety of reasons. Uncertainty about the outcome of an event like hitting the debt ceiling could push volatility levels higher without sending equity prices sharply lower. The point is the term structure just provides clues as it is not the holy grail about looking in the future.
What the Volatility term structure does tell us is that the marketplace expects a significant increase in overall volatility in the next 3 – 6 months. What I think the Volatility Term Structure is conveying presently is that decisions regarding the fiscal cliff and the debt ceiling will impact market prices, However the real impact may not be felt until later in the 1st or 2nd Quarters of 2013.
Most economists believe that if we do go over the fiscal cliff and taxes go up for everyone that the U.S. economy will be in recession within 6 – 9 months. Clearly as shown above, the Volatility Term Structure likely agrees with the economists assessments and the economic conditions in the next 6 to 7 months could possibly turn for the worse.
All we can hope for is that the politicians can compromise on a plan that will remove uncertainty from the marketplace without compromising the economy. Something tells me that is not likely to happen, but here is to hoping that I'm wrong!
Happy Trading!
Risk-FREE 30-Day Trial
only $1 for the first 30 days!
JW Jones
www.TradersVideoPlaybook.com
J.W. Jones is an independent options trader using multiple forms of analysis to guide his option trading strategies. Jones has an extensive background in portfolio analysis and analytics as well as risk analysis. J.W. strives to reach traders that are missing opportunities trading options and commits to writing content which is not only educational, but entertaining as well. Regular readers will develop the knowledge and skills to trade options competently over time. Jones focuses on writing spreads in situations where risk is clearly defined and high potential returns can be realized.
This article is intended solely for information purposes. The opinions are those of the author only. Please conduct further research and consult your financial advisor before making any investment/trading decision. No responsibility can be accepted for losses that may result as a consequence of trading on the basis of this analysis.
© 2005-2022 http://www.MarketOracle.co.uk - The Market Oracle is a FREE Daily Financial Markets Analysis & Forecasting online publication.