Gold And Silver Very Under-Rated Opposing Forces Into 2013
Commodities / Gold and Silver 2013 Dec 31, 2012 - 10:13 AM GMTBy: Michael_Noonan
 It is impossible not to read some source, informed or otherwise, touting the “fact” that the price of gold and silver will be [insert whatever amount you wish, here], “in the coming months”, or safer, “in the next year or two,” etc. Yet, the market does not echo those almost universally held sentiments.
Why not?
Because that is exactly what they are, sentiments. When it comes to sentiments or opinions, regardless of how close to source or how well reasoned, the market does not care. One of the better “resolutions” one can make going into 2013 and beyond it to follow the market’s lead, stop trying to lead it, waiting for it to catch up to your trading acumen.
But what about the shortages in silver production v demand? What about the overly re-re-hypothecated gold leases from central banks that cannot possibly cover actual demands for gold? What about the possibility that all of Germany’s [and other countries?] gold is gone and so much of it is being transferred to the East? What about [insert whatever issue you wish discussed, here]?
Yes, well what about it! That information is and has been known for quite some time, so it is already “priced into the market.” It does not matter how well-informed your source[s] is. It does not matter how accurate the figures are for available supply v demand. The market is all knowing, and it is ahead of you, and it is responding to forces about which you are not aware, hidden deals, as an example.
It does not matter how much gold there is, or isn’t. It does not matter where the gold is, or isn’t, the market is telling you what you all you need to know.
Everything finds its way into the market, and if you would just ignore all else and follow the ultimate known fact, that being the current price of anything, then you have the answer right in front of you. The problem is, too many cannot reconcile the current price of gold and silver relative to their expectations. [From the buy side.]
John Keats would have made an excellent technical analyst, for he excelled at drawing out the paradoxical nature of things, leaving us with a few of his most famous lines that apply to the above:
‘Beauty is Truth, Truth Beauty’ — that is all Ye know of earth, and all ye need to know. From ‘Ode On A Grecian Urn’
This is how we see charts. Everything you need to know is contained within them because they are based on truth. What truth? The ultimate decisions to buy or sell made by the collective forces of the marketplace. Anything else that does not get translated directly in the market is simply an opinion, of no factual value because the market only recognizes actual transactions.
That is the truth and the beauty of the markets. They provide you factual commitments, unadorned by uncommitted interpretive opinions. That is all ye need to know on earth. Learn to listen to what the market is saying, and not what others are saying about the market.
This is not to say that markets cannot be manipulated and factors grossly distorted, for even if they are, those manipulation and distortions are what is reflected in current princes, like it or not.
Most who speculate in the markets, to the extent they rely upon charts, look at daily or intra day time frames. Smart money, what we call the “controlling forces” of a market, use higher time frames, for they are not concerned with day-to-day activity. Their positions and influence necessitate that they move over a more extended period of time, and one can get a greater sense of their intent from the higher time frames.
When we talk about collective forces of the marketplace, it includes the most well-informed insiders, central bankers, the largest dealers, with availability to information and research outsiders may never know or learn about, until after the fact, all the way down to investors, fundamentalists, speculators, even the ephemeral day-traders. What they all have in common is that they are the market, once they make a decision to execute a buy/sell that influences and determines the price at any given point in time. Those executed decisions, regardless of how well or ill-informed, become market facts that comprise fluctuations, and they show up as the high, low, and close on a chart for any chosen time frame.
Despite the relentless calls for gold and silver “taking off,” which they have not, of late, the elephants in the room, governments, central bankers and major brokers, plus exchanges, have been vastly under-rated in their ability to keep the prices of gold and silver suppressed as much as they have. They are not about to throw in the towel and give up their Wizard of Oz controls. Ultimately, they are doomed to fail, but when does “ultimately” kick in, and to what degree of damage before it does, remains unknown?
One thing you should know about the opposition, in whatever form it is in, ultimately: It will not stop. It will not quit. It will destroy everything that gets into its way in order to suit its needs.
The charts have been saying as much. The annual and quarterly charts had to be scanned because most services do not provide any beyond the monthly time frame. The comments on the charts may be hard to read, so we will put them in italics to make it easier.
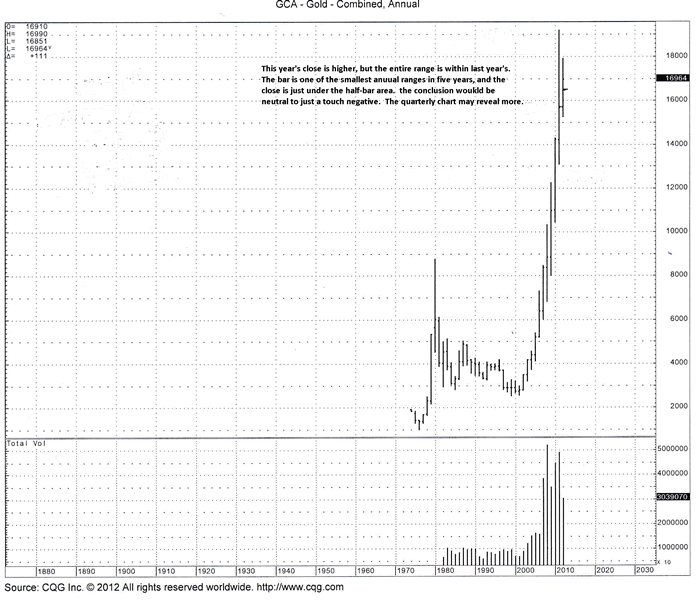
If gold and silver are going to go to such high price levels, why are charts saying the opposite? This end of year’s gold closing, actually Monday, is about mid-range the bar, a draw between the forces of supply and demand, but the range was the smallest in several years. Neither buyers nor sellers were able to extend the range further in either direction.
Chart comments:
This year’s close is higher, but the entire range is within last year’s. The bar is one of the smallest annual ranges in five years, and the close is just under the half-bar area. The conclusion would be neutral to just a touch negative. The quarterly chart may reveal more.
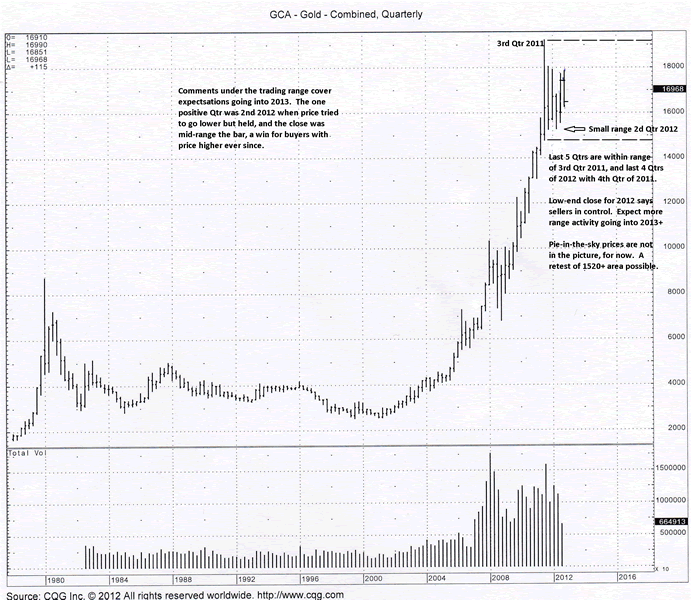
The arrow in the chart points to the smallest range in Qtr 2, 2012. It was an attempt to go lower that failed. The fact, and keep in mind the focus is on the indisputable facts contained in the charts, that price did not go lower speaks to strong support at that level.
Another observable fact is how the last 5 quarterly bars have been overlapping. Anytime you see bars overlapping, it show a struggle between buyers and sellers trying to exert control. The poor end of the year close for gold says buyers have not been keeping an upper hand, and sellers are maintaining relentless pressure.
Chart comments:
Comments under the trading range cover expectations going into 2013. The one positive Qtr was 2nd, 2012, when price tried to go lower but held, and the close was mid-range the bar, a win for buyers with price higher ever since.
Last 5 Qtrs are within range of 3rd Qtr 2011, and the last 4 Qtrs within 4th Q 2011.
Low-end close for 2012 says sellers in control. Expect more price range activity going into 2013+.
Pie-in-the-sky prices are not in the picture, for now. A retest of 1520+ area possible.
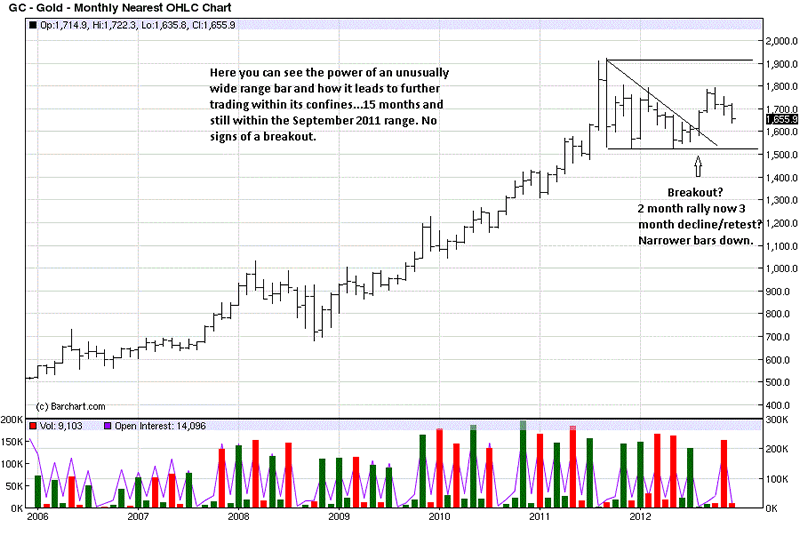
Back to our normal chart. If we view the rally in August as a breakout from a right triangle pattern, it is taking now 3 months to correct a 2 month rally, and the bars correcting are smaller, telling us there is no downward ease of movement. This suggests sellers are meeting more resistance, but still prevailing.
2013 will be an interesting years, and its start could be signaling more of what we have seen for the past 15 months. While accumulation of the physical metal is strongly recommended, trading in the paper futures will have to be much more select, buying breaks, not breakouts.
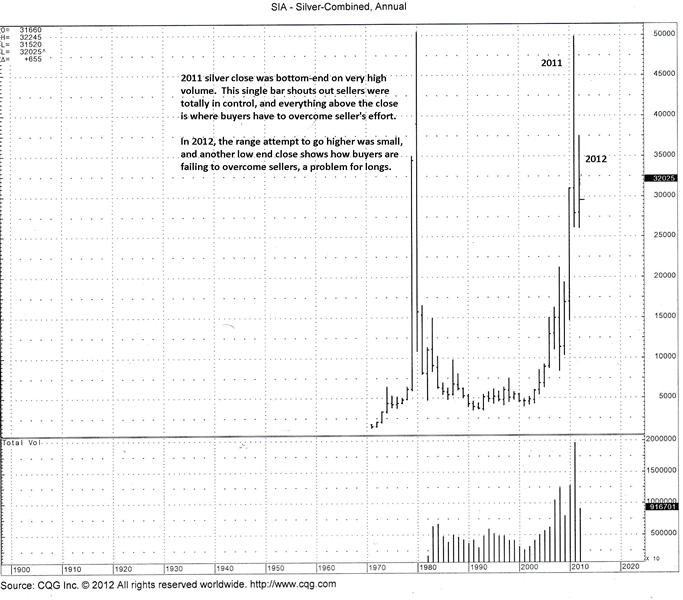
There is no question that silver remains relatively weaker to gold, as the charts clearly show. Some think silver may outperform gold, moving forward, and it has, on occasion. That is an opinion that may or may not hold true. Buying and personally holding the physical is strongly recommended, as was stated for gold. For now, silver has a very large supply factor hanging over future progress, based upon the closes of 2011 and 2012.
Chart comments:
2011 silver close was bottom-end on very high volume. This single bar shouts out sellers were totally in control, and everything above the close is where buyers have to overcome seller’s efforts, and that is a pretty large area to regain.
In 2012, the range attempt to go higher was small, and another low end close shows how buyers are failing to overcome sellers, a problem for longs.
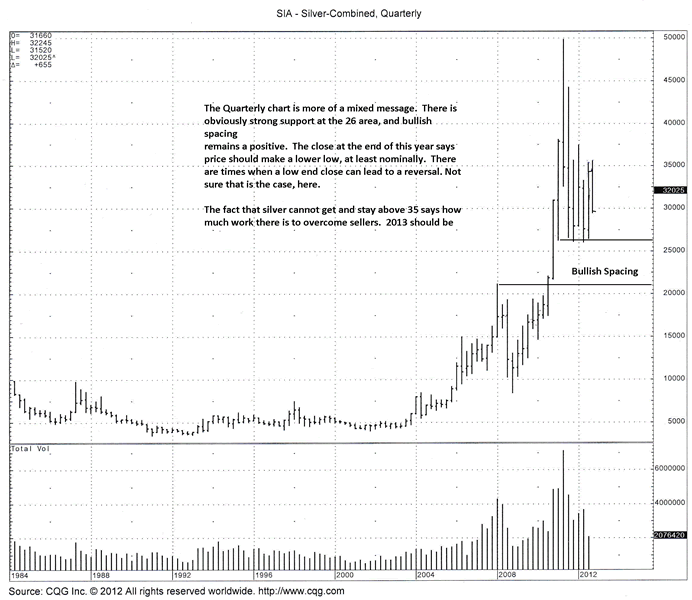
The more detailed Qtrly chart has one positive aspect: 26.20+ area held like a rock. We could see yet another test and possible new low. That is not a prediction but a point of view not to be dismissed for the year ahead. As with gold, the overlapping of bars shows the struggle between the forces of sellers and buyers, the edge with sellers.
Chart comments:
The Qtrly chart is more of a mixed message. There is obviously strong support at the 26 area, and bullish spacing remains a positive. [Bullish spacing is where the current swing low is above the last swing high, indicating buyers not willing to wait to see of the last swing high will be retested. It reflects a sense of urgency to buy.] The close at the end of this year says price should make a lower low, at least nominally, [Compared to last Qtr low only]. There are times when a low end close can lead to a reversal. Not sure that is the case, here. [Just another possibility of which to be aware.]
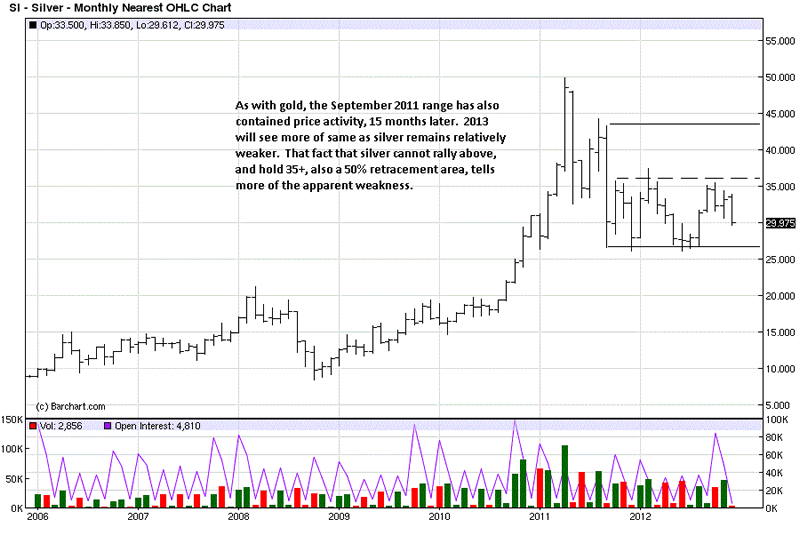
The fact that silver cannot get and stay above 35 says how much work there is to overcome sellers. 2013 should be more of the same, at least for the first half.
As with gold, an unusually large bar most often foretells of a protracted trading range to follow. Not only did that hold true for silver, the trading range was all under a 50% retracement area, telling us how rally attempts have been weak, and also a signal from the market that $50, $100, $250 silver is not on the immediate horizon.
It does not take a crystal ball, nor a Seer to look ahead into 2013 and know, almost beyond a doubt that silver has its work cut out for the next several months, and one should be very careful when trading futures, while still buying the physical with impunity.
We did not need to know of any “story” behind either precious metal. The charts are all-knowing, and they present everything known about the price, sans any opinion[s]. Just deal with the facts and plan accordingly. Trust the markets. They never lie.
By Michael Noonan
Michael Noonan, mn@edgetraderplus.com, is a Chicago-based trader with over 30 years in the business. His sole approach to analysis is derived from developing market pattern behavior, found in the form of Price, Volume, and Time, and it is generated from the best source possible, the market itself.
© 2012 Copyright Michael Noonan - All Rights Reserved Disclaimer: The above is a matter of opinion provided for general information purposes only and is not intended as investment advice. Information and analysis above are derived from sources and utilising methods believed to be reliable, but we cannot accept responsibility for any losses you may incur as a result of this analysis. Individuals should consult with their personal financial advisors.
Michael Noonan Archive |
© 2005-2022 http://www.MarketOracle.co.uk - The Market Oracle is a FREE Daily Financial Markets Analysis & Forecasting online publication.


