


Gold, Stocks, Oil and Gas Trend Analysis and Trading Signals
Stock-Markets / Financial Markets 2013 Jan 14, 2013 - 02:45 AM GMTBy: Chris_Vermeulen

 Gold and gold miner stocks have underperformed in 2012 disappointing most traders. That being said it has traded in a large sideways range since September 2011 and remains stuck in this range as of this week. Investments trading sideways are not my preferred investment of choice because some commodities and stocks for that matter can trade sideways for years before making another bull market rally.
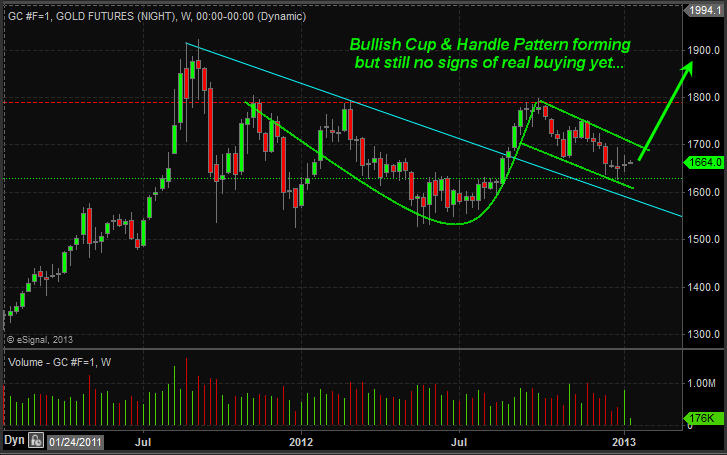
That being said in the last six months gold has started to show life that a new bull market may be starting. 2013 is starting to look as though gold, silver and precious metals miners could lead the market higher if they can break out of their basing patterns. Until we get more bullish price action I am not planning to get long.
Take a look at the gold ETF and Gold Miner charts:
These daily charts show the trend (up/down) along with short term extreme overbought/oversold trading days. The key to long term success is to trade with the trend 90% of the time. Only years of experience will you know when it’s ok to break the rules and even then the odds are stacked against you.
Gold Weekly Chart:
Gold Daily Chart:

Gold Miners Daily Chart:

SP500 Stock Market Analysis:
The last five years I have been fine tuning my SP500 index trading with the use of cycles, sentiment, volume, momentum and the volatility index. Until just recently some of the data I use for generating these extreme overbought/oversold conditions were only available after the market closed. This made the high volatile trading sessions difficult to truly know if an extreme level was reached during the trading session. The exciting news is that a new data feed and a top notch programmer is allowing me to turning this once manual calculation of 17 data points taking me an average of 25 minutes to figure out into a system that generates signals in real time complete with profit taking signals, tend direction and a protective stop which self-adjusts depending on the market volatility and cycle stages.
Two other benefits are that during extremely high volatility levels and mixed cycles the system does not generate any signals. This allows us to avoid the large daily swings in price that typically shake even the most seasoned traders out of the market for repeated losing trades. Also during potential trend changes when cycles and volatility become choppy trading signals are not generated helping to avoid the volatility that takes place during reversals points when the bulls and bears are pushing each other around.
Below is a very basic version of the trend and signals for the SP500 index as it does not show profit taking, trend reversal stops or protective stops for individual swing trades yet, but it’s coming soon.

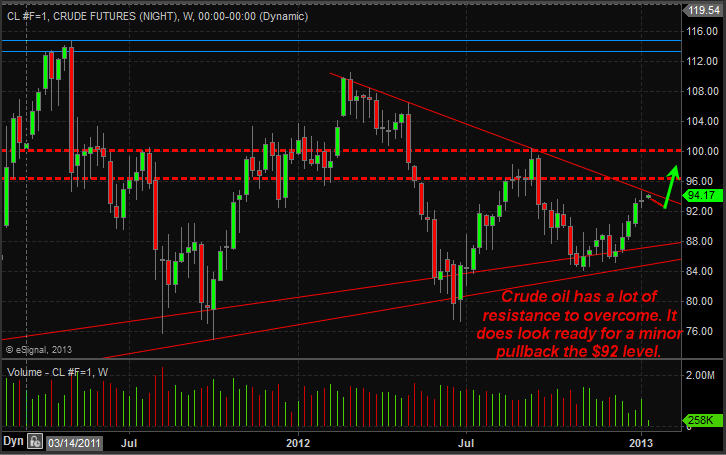
Crude Oil Weekly Chart:
Crude oil has been making a move higher in the past four weeks but it’s now testing resistance and the chart shows a high volume doji candle. This is pointing to a pause or pullback in price should take place.
Natural Gas Weekly Chart:
Natural gas futures have been under pressure the past couple months but it may have put in a bottom last week. The daily and 60 minute charts show strong buyers stepping in here.

Weekend Trading Conclusion:
In short, gold and silver remain in a sideways/down trend on the daily chart. The weekly long term outlook is very bullish and once I start to see real buyers enter the market in terms of volume and price patterns I will start to accumulate a long position.
The stock market overall remains in an uptrend. We are waiting for a pause ro pullback before getting long the index. But that being said there are other sectors and commodities starting to look ripe for big moves. They are not there yet but getting closer each day.
Keep in mind that stocks, commodities and trading in general go in waves. There are times when you are busy with trades popping up left right and center and there are times when setups just do not happen. On my free stock charts watch list in November and December I posted 16 stocks and ETF setups and only one stock went south which happened to be a short trade (count trend trade). You can view my watch list here for more info: https://stockcharts.com/public/1992897
Crude oil is giving mixed signals and I am avoiding it until the daily chart gives us a bullish setup.
Natural gas weekly chart looks bullish but the current price is now trading at resistance. It must break this level before a full reversal can be confirmed.
If you would like to keep up to date on market trends and trade ideas be sure to join my newsletter at http://www.thegoldandoilguy.com
By Chris Vermeulen
Please visit my website for more information. http://www.TheGoldAndOilGuy.com
Chris Vermeulen is Founder of the popular trading site TheGoldAndOilGuy.com. There he shares his highly successful, low-risk trading method. For 7 years Chris has been a leader in teaching others to skillfully trade in gold, oil, and silver in both bull and bear markets. Subscribers to his service depend on Chris' uniquely consistent investment opportunities that carry exceptionally low risk and high return.
This article is intended solely for information purposes. The opinions are those of the author only. Please conduct further research and consult your financial advisor before making any investment/trading decision. No responsibility can be accepted for losses that may result as a consequence of trading on the basis of this analysis.
Chris Vermeulen Archive |
© 2005-2022 http://www.MarketOracle.co.uk - The Market Oracle is a FREE Daily Financial Markets Analysis & Forecasting online publication.