


Gold Demand: East vs. West
Commodities / Gold and Silver 2013 Jan 18, 2013 - 04:30 PM GMTBy: Clif_Droke

 Gold, as defined by the SPDR Gold Trust (GLD), has been a less than stellar performer of late. I’ve long maintained that the 150-day moving average is a psychologically significant benchmark for the gold ETF, both as a line of support and resistance. GLD’s performance in recent weeks has only confirmed this observation.
The 3-year daily chart for GLD shown below illustrates the progression of the price line in relation to the 150-day (30-week) MA. Note the refusal of GLD to slide below the 150-day MA during the bull market years of 2010-2011. Since the long-term trend line broke in December 2011, GLD has had great difficulty in maintaining its footing above this important trend line. As you can see, there have been two breakouts above the 150-day MA since last year with the first one ending in failure. The second and more recent attempt in late August 2012 looks stronger in that GLD spent nearly four months above it and is, as of this writing, slightly above the still-rising 150-day MA
Gold is still technically in a neutral position of trending laterally along the 150-day MA, but this could soon change if gold is able to gain some traction in the coming days. On an immediate-term basis, GLD confirmed an immediate-term bottom in relation to its 15-day moving average recently.
Gold Demand
In analyzing the demand for physical gold bullion and bullion coins, it would appear that Asian countries are leading the charge. Mature economies such as the U.S. and Australia, however, have seen diminishing demand for physical gold in recent years.
Sharps Pixley is reporting that the recent sharp drop in gold price has resulted in an increase in Asian demand for physical bullion. On Jan. 7, the Shanghai Gold Exchange 99.99 percent purity gold contract's trading volume jumped to a record high of 19,504.8kg. Chinese demand for gold generally rises before the Chinese New Year, which will begin on Feb. 9. According to the Hong Kong government, China imported 90.764 tons of gold in November, almost doubled from the 47.478 tons in October. Bloomberg calculated that during the first 11 months in 2012, gold shipments almost doubled from 392.564 tons a year ago to 720.091 tons.
Investors looking for another bullish fundamental case for gold are also looking to Japan. Japan's new Prime Minister, Shinzo Abe, has renewed the government’s fight against deflation and is trying to spur economic growth in Japan partly by increasing interest in gold as an asset class among the country’s pension funds.
Last week, the World Gold Council's Tokyo representative expected that the Japanese pension funds would likely double their investments in gold-backed ETPs to 100 billion yen by 2015. Assets under management in Japanese pension funds amount to $3.36 trillion, according to Towers Watson & Co. Currently, the top three pension funds in Japan, with assets of about $1.75 trillion, have hardly any allocation to gold, but have about 65 percent in Japanese bonds. If these three funds allocate just 1 percent to gold, this would be equivalent to about 300 tons of gold based on the current price of $1,660/oz.
According to Gold Fields Mineral Services, investors added an average of 300 tons of gold per year since the end of 2004, which has led gold to jump about 18 percent per annum. Some analysts are forecasting that the additional 300 tons of demand from Japan could eventually catalyze an 18% increase in the gold price in the coming year.
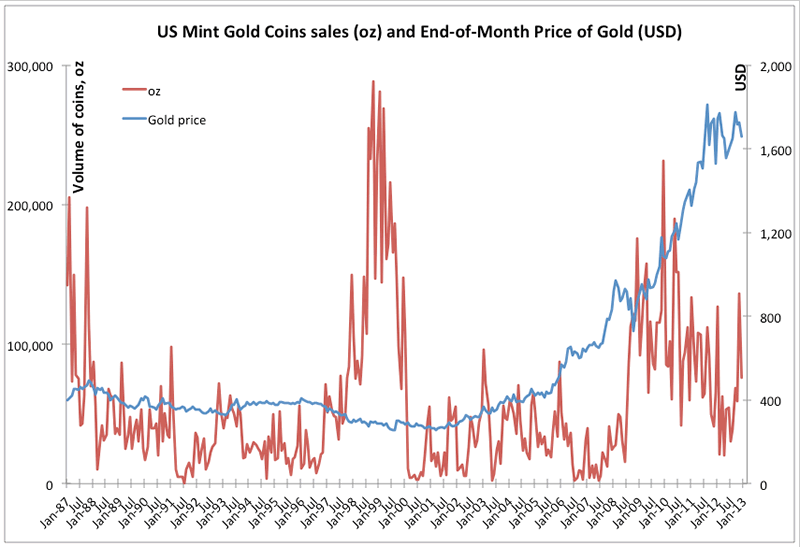
While Asian demand could help stabilize the yellow metal price in the coming months, gold’s fortunes aren’t likely to significantly improve until U.S. demand improves. The International Business Times is reporting that the U.S. Mint’s gold coin sales slid for a third consecutive year in 2012, showing how demand for gold bullion among the retail public remains lackluster at best. According to the Times, “Demand remains well below the record levels seen preceding the Y2K scare in 1999 and below the levels seen when the coins were first launched in 1987 and in the aftermath of the Wall Street Crash of October 1987.”
The U.S. Mint sold 753,000 troy ounces of American Eagle gold coins in 2012, according to data posted on its website, down 25% from a year earlier and the lowest full-year sales since 2007. (See graph below courtesy International Business Times). Other government mints such as the Perth Mint of Western Australia have said that they saw a fall in demand in 2012.
GoldCore believe that the fall in demand is due to renewed complacency regarding the global debt crisis. It is also likely due to the fact that traditional buyers of gold coins and bars have secured their allocation to store of wealth gold bullion in recent years, according to Sharps Pixley. The Times article speculates that diminished demand for U.S. gold coins “may also be because there are only a few new retail buyers coming into the bullion market in western countries – unlike in Asian countries and particularly China.”
2014: America's Date With Destiny
Take a journey into the future with me as we discover what the future may unfold in the fateful period leading up to - and following - the 120-year cycle bottom in late 2014.
Picking up where I left off in my previous work, The Stock Market Cycles, I expand on the Kress cycle narrative and explain how the 120-year Mega cycle influences the market, the economy and other aspects of American life and culture. My latest book, 2014: America's Date With Destiny, examines the most vital issues facing America and the global economy in the 2-3 years ahead.
The new book explains that the credit crisis of 2008 was merely the prelude in an intensifying global credit storm. If the basis for my prediction continue true to form - namely the long-term Kress cycles - the worst part of the crisis lies ahead in the years 2013-2014. The book is now available for sale at:
http://www.clifdroke.com/books/destiny.html
Order today to receive your autographed copy and a FREE 1-month trial subscription to the Momentum Strategies Report newsletter.
By Clif Droke
www.clifdroke.com
Clif Droke is the editor of the daily Gold & Silver Stock Report. Published daily since 2002, the report provides forecasts and analysis of the leading gold, silver, uranium and energy stocks from a short-term technical standpoint. He is also the author of numerous books, including 'How to Read Chart Patterns for Greater Profits.' For more information visit www.clifdroke.com
Clif Droke Archive |
© 2005-2022 http://www.MarketOracle.co.uk - The Market Oracle is a FREE Daily Financial Markets Analysis & Forecasting online publication.