


How to Trade Options Around Corporate Earnings
Companies / Options & Warrants Jan 22, 2013 - 03:20 PM GMTBy: J_W_Jones

 The hallmark of a professional option trader is the ability to use a wide variety of trade structures in order to exploit opportunities to profit from specific situations the market presents. One of the opportunities routinely presented multiple times yearly is the impending release of earnings.
Underlying the logic of earnings trades is the stereotypic pattern of increasing implied volatility of options as earnings approach. This pattern is so reliably present that experienced options traders can recognize the approximate date of an impending earnings release by simply perusing the implied volatility of the various series of upcoming options.
As a real time example of this phenomenon, consider the current option chain of AAPL which will report earnings after the market closes on Wednesday, January 23.

As can clearly be seen, the front weekly options, the first series in time following the impending earnings release, has dramatically elevated implied volatility as compared to the series expiring later.
It is because the release of earnings routinely causes reversion of the elevated implied volatility toward its historic mean value that a number of high probability trades can often be constructed surrounding earnings.
I thought it would be instructive to review a recent earnings trade I made in order to see how this consistently observed collapse of implied volatility works in practical terms.
EBAY was scheduled to report earnings after the market closed on Wednesday, January 16. As the price chart below reflects, EBAY had recently rallied and was trading in the price range circled in red.
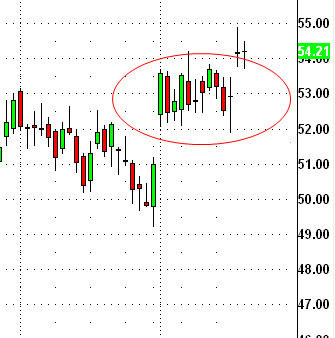
At the time of the upcoming earnings release, there were only a few days of life left in the
January options which would expire the following Friday afternoon. The then current implied volatility situation can be seen in the option chain displayed below.
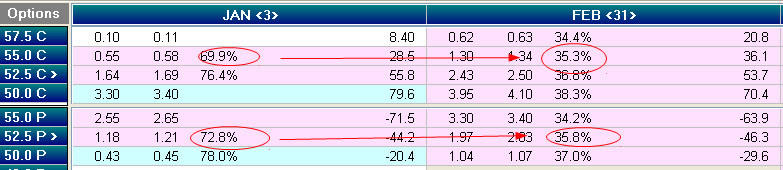
Note the elevated implied volatility in the January options as compared to the February options. The value is around twice that of the February options and clearly demonstrates this routinely observed spike as we also have seen above in the case of AAPL options.
My operating assumption was that EBAY would trade down slightly following earnings. This was wrong. As we will see however, proper trade construction resulted in a nicely profitable trade despite incorrect price prediction.
After considering a number of potential trades, I decided to use a short strangle in an attempt to capture the collapse of implied volatility. As a brief review, remember that a short strangle is a two legged position and consists of both a short out-of-the-money call and short out-of-the-money put.
Because my price hypothesis was that EBAY would sell off a bit, I weighted the strangle to the downside slightly by selling different quantities of puts and calls. The P&L graph of the position I took late Wednesday afternoon is displayed below.
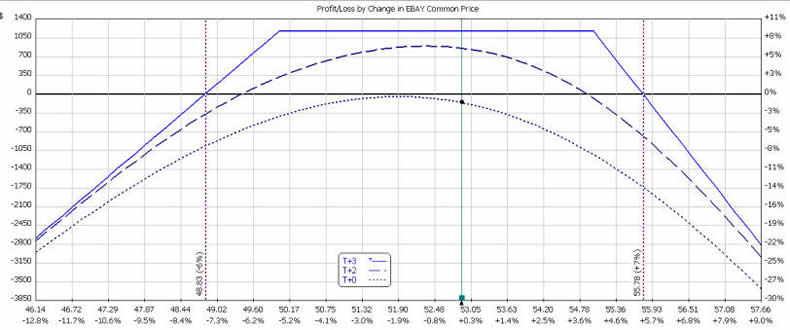
The earnings were a bit better than anticipated and resulted in a modest price increase. I was able to exit the position shortly following the market open on Thursday morning for a profit of 6.45% based on the margin encumbrance required to maintain the position under Regulation T rules.
The results of this trade illustrate two critically important points for the new options trader to
understand clearly. First, my price assumption was wrong but the trade was still profitable. For those used to trading stock this may be almost an unbelievable result since in the world of stock trading there is no margin of error for an incorrect price assumption.
The second point is closely linked to the first. The second assumption in this trade was that
implied volatility would decrease substantially. This did in fact happen, the implied volatility of the 55 strike calls decreased from the 69.9% shown above to a post earnings release of 23%.
It was this volatility collapse in both the puts and calls that resulted in the profitability of the trade. Had I used my same price assumptions and constructed the trade using stock, the trade would have been a loser. We invite you to try our service to see how proper trade construction and position sizing can result in a high probability of success.
Happy Option Trading!
 If you are looking for a simple one trade per week trading style then be sure to join www.OptionsTradingSignals.com today with our 14 Day Trial.
J.W. Jones is an independent options trader using multiple forms of analysis to guide his option trading strategies. Jones has an extensive background in portfolio analysis and analytics as well as risk analysis. J.W. strives to reach traders that are missing opportunities trading options and commits to writing content which is not only educational, but entertaining as well. Regular readers will develop the knowledge and skills to trade options competently over time. Jones focuses on writing spreads in situations where risk is clearly defined and high potential returns can be realized.
This article is intended solely for information purposes. The opinions are those of the author only. Please conduct further research and consult your financial advisor before making any investment/trading decision. No responsibility can be accepted for losses that may result as a consequence of trading on the basis of this analysis.
J.W. Jones Archive |
© 2005-2022 http://www.MarketOracle.co.uk - The Market Oracle is a FREE Daily Financial Markets Analysis & Forecasting online publication.