


Fib Study - Stock Market Investors Could Be in for Biggest Fall in History
Stock-Markets / Stocks Bear Market Jan 23, 2013 - 09:08 AM GMT

 Here is a Fibonacci study of the rally from October 4, 2011. My first observation is that everything, I mean everything is a ZIGZAG. The A-B-C (zigzag formations) are also 3-3-3 formations, all of them and at all degrees. That is what makes this rally so irregular. There is literally nothing to hang your hat on, as far as the Elliott Waves unless you can step back and look at the whole picture, so that is what I have done.
A Fibonacci time study reveals that the market followed the structure of an Ending Diagonal almost precisely, starting on November 25, 2011.
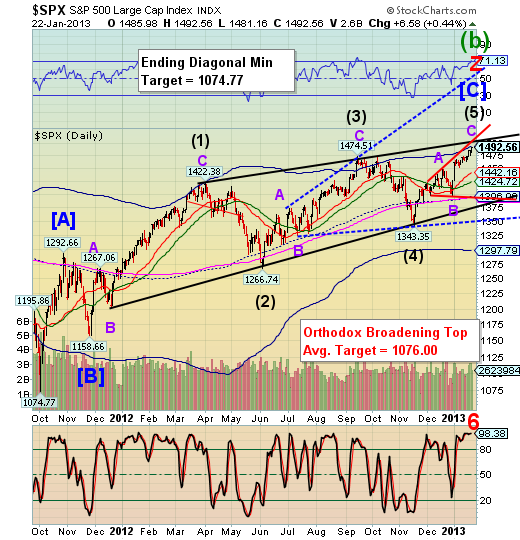
· Wave (1) lasted 129 days.
· Wave 3 lasted 102 days, 79% (.786) of the time in Wave (1)
· As of tomorrow, Wave (5) will have spent 68 days, which is 66.66% of the time in Wave (3). The minimum time relationship in a Diagonal is 61.8%, so we may already have a match.
· By the way, both waves (2) and (4) were precisely 63 days each.
A Fibonacci elevation study shows the following:
· Wave (1) was 263.72 points.
· Wave (3) was 207.77 points, which is 78.78% (78.6)the length of (1)
· If Wave (5) is 78.6% of (3), it would have a target of 1506.66.
A further refinement shows that:
· Wave A of (1) is 108.40 points, while Wave C of (1) is 220.01 points, yielding nearly a Fibonacci 203% relationship
· Wave A of (3) is 108.07 points, while Wave C of (3) is 149.1 points, yielding a Fibonacci 138% relationship, or 62.7% of C of (1)
· Wave A of (5) is 104.65 points, while Wave C of (5) would finish an exact Fibonacci 100% (of A) relationship at 1502.76.
Finally, since the Wave A’s are almost equal, an examination of the relationship of the C’s yields a potential target range of 1491.60 to 1499.16, suggesting that Wave (5) may already be complete, or nearly so. Cycle Top resistance is at 1494.32. Furthermore, there is a lot of resistance at round numbers. It may take more energy than the market has, especially this late in the cycle, to break through 1500.00. If it does break through, we may only see it above 1500.00 for a brief time, just as the Dow had trouble breaking 1,000 from 1966 through 1982.
It appears that I may have exhausted this topic, but it has been enlightening for me as well. Another analyst has called this the largest Ending Diagonal (Bearish Wedge) in history. I believe him. It is so large that virtually no one has been able to recognize it for what it is. Considering that investors are “all in,” it would be no surprise that the very first fall from this level may also be the longest in history, as well.
Regards,
Tony
Our Investment Advisor Registration is on the Web
We are in the process of updating our website at www.thepracticalinvestor.com to have more information on our services. Log on and click on Advisor Registration to get more details.
If you are a client or wish to become one, please make an appointment to discuss our investment strategies by calling Connie or Tony at (517) 699-1554, ext 10 or 11. Or e-mail us at tpi@thepracticalinvestor.com .
Anthony M. Cherniawski, President and CIO http://www.thepracticalinvestor.com
As a State Registered Investment Advisor, The Practical Investor (TPI) manages private client investment portfolios using a proprietary investment strategy created by Chief Investment Officer Tony Cherniawski. Throughout 2000-01, when many investors felt the pain of double digit market losses, TPI successfully navigated the choppy investment waters, creating a profit for our private investment clients. With a focus on preserving assets and capitalizing on opportunities, TPI clients benefited greatly from the TPI strategies, allowing them to stay on track with their life goals
Disclaimer: The content in this article is written for educational and informational purposes only. There is no offer or recommendation to buy or sell any security and no information contained here should be interpreted or construed as investment advice. Do you own due diligence as the information in this article is the opinion of Anthony M. Cherniawski and subject to change without notice.
Anthony M. Cherniawski Archive |
© 2005-2022 http://www.MarketOracle.co.uk - The Market Oracle is a FREE Daily Financial Markets Analysis & Forecasting online publication.