


Decline of the Middle Class Under Obama
Politics / Social Issues Jan 23, 2013 - 03:27 PM GMTBy: Money_Morning

 Ben Gersten writes: U.S. President Barack Obama often makes a point of talking about how important our country's middle class is to our economic growth - something he reiterated yesterday (Monday) in his second inauguration speech.
"Our country cannot succeed when a shrinking few do very well and a growing many barely make it," President Obama said. "We believe that America's prosperity must rest upon the broad shoulders of a rising middle class."
But the financial reality that currently faces the U.S. middle class is not one that can support a country's economic future.
For example, many middle-class workers have lost jobs or taken a pay cut since the president took office in 2009, and the 7.8% unemployment rate is the same as when President Obama first took office.
The labor force participation rate - the percentage of working-age people who are employed or actively seeking jobs - is at its lowest level in over 30 years, and those who are working are making a lower median income than they did 10 years ago.
At the same time, almost half of Americans are unprepared for financial emergencies. About 49% of Americans don't have enough money saved to cover three months of expenses and 28%don't have any money saved, according to a survey by consumer financial services firm Bankrate.com.
Here are five startling charts that outline a middle class decline that's taken shape under President Obama.
Middle Class Decline Under President Obama
Economy Offers Fewer Middle-Wage Jobs: Of the more than six million jobs lost during the recession, measured as Q1 2008-Q1 2010, the majority of jobs lost were middle-wage jobs.
In the recovery, Q1 2010- Q1 2012, the majority of jobs gained were low-paying ones. Low-wage jobs, paying between $7.69 and $13.83 an hour, made up 21% of recession job losses, but 58% of jobs added in the recovery.
Middle-wage jobs, paying between $13.84 and $21.13, comprised 60% of recession job losses, but only 22% of jobs added in recovery. Higher-wage jobs, paying $21.14 to $54.55, accounted for 19% of recession job losses and 20% of jobs gained in the recovery. The chart below shows the growth rate in each category since 2001.

Source: National Employment Law Project
Household Income Declines: As of November 2012, median U.S. household income was $51,310. That's $3,850 lower than when President Obama took office in January 2009, according to an analysis of census data by economic consulting firm Sentier Research. This chart shows median household income is not only lower than it was four years ago, but lower than when President Bill Clinton left office in 2001.

Source: Sentier Research
Young and Middle-Age Workers Earn Less: Not only has household income decreased, but it has fallen the most among younger and middle-age workers. Median wages for men between 25 and 64 dropped 19% from 1971 to 2011, to $34,000 a year, according to Massachusetts Institute of Technology professor Michael Greenstone. This prevents them from saving enough now for their retirement, setting up a U.S. retirement crisis. Here's a breakdown:

Food Stamp Use at All-Time High: The number of Americans on food stamps is at an all-time high. That number has increased over 50% in the past four years, going from 31.6 million Americans in December 2008 to 47.7 million as of September 2012.
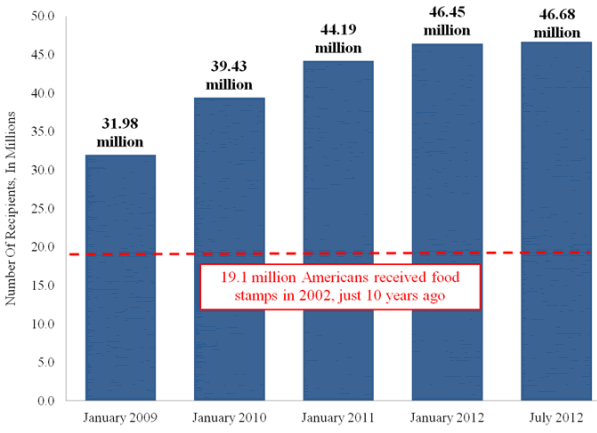
Source: U.S. Senate Budget Committee
Gas prices have almost doubled: Gas prices have climbed from the national average of $1.78 a gallon in January 2009 to the current average of $3.33. Several times the average price of gas has neared $4 during President Obama's first term.

Source :http://moneymorning.com/2013/01/22/middle-class-decline-under-obama-shown-in-5-charts/
Money Morning/The Money Map Report
©2013 Monument Street Publishing. All Rights Reserved. Protected by copyright laws of the United States and international treaties. Any reproduction, copying, or redistribution (electronic or otherwise, including on the world wide web), of content from this website, in whole or in part, is strictly prohibited without the express written permission of Monument Street Publishing. 105 West Monument Street, Baltimore MD 21201, Email: customerservice@moneymorning.com
Disclaimer: Nothing published by Money Morning should be considered personalized investment advice. Although our employees may answer your general customer service questions, they are not licensed under securities laws to address your particular investment situation. No communication by our employees to you should be deemed as personalized investent advice. We expressly forbid our writers from having a financial interest in any security recommended to our readers. All of our employees and agents must wait 24 hours after on-line publication, or after the mailing of printed-only publication prior to following an initial recommendation. Any investments recommended by Money Morning should be made only after consulting with your investment advisor and only after reviewing the prospectus or financial statements of the company.
Money Morning Archive |
© 2005-2022 http://www.MarketOracle.co.uk - The Market Oracle is a FREE Daily Financial Markets Analysis & Forecasting online publication.