Most Popular
1. It’s a New Macro, the Gold Market Knows It, But Dead Men Walking Do Not (yet)- Gary_Tanashian
2.Stock Market Presidential Election Cycle Seasonal Trend Analysis - Nadeem_Walayat
3. Bitcoin S&P Pattern - Nadeem_Walayat
4.Nvidia Blow Off Top - Flying High like the Phoenix too Close to the Sun - Nadeem_Walayat
4.U.S. financial market’s “Weimar phase” impact to your fiat and digital assets - Raymond_Matison
5. How to Profit from the Global Warming ClImate Change Mega Death Trend - Part1 - Nadeem_Walayat
7.Bitcoin Gravy Train Trend Forecast 2024 - - Nadeem_Walayat
8.The Bond Trade and Interest Rates - Nadeem_Walayat
9.It’s Easy to Scream Stocks Bubble! - Stephen_McBride
10.Fed’s Next Intertest Rate Move might not align with popular consensus - Richard_Mills
Last 7 days
THEY DON'T RING THE BELL AT THE CRPTO MARKET TOP! - 20th Dec 24
CEREBUS IPO NVIDIA KILLER? - 18th Dec 24
Nvidia Stock 5X to 30X - 18th Dec 24
LRCX Stock Split - 18th Dec 24
Stock Market Expected Trend Forecast - 18th Dec 24
Silver’s Evolving Market: Bright Prospects and Lingering Challenges - 18th Dec 24
Extreme Levels of Work-for-Gold Ratio - 18th Dec 24
Tesla $460, Bitcoin $107k, S&P 6080 - The Pump Continues! - 16th Dec 24
Stock Market Risk to the Upside! S&P 7000 Forecast 2025 - 15th Dec 24
Stock Market 2025 Mid Decade Year - 15th Dec 24
Sheffield Christmas Market 2024 Is a Building Site - 15th Dec 24
Got Copper or Gold Miners? Watch Out - 15th Dec 24
Republican vs Democrat Presidents and the Stock Market - 13th Dec 24
Stock Market Up 8 Out of First 9 months - 13th Dec 24
What Does a Strong Sept Mean for the Stock Market? - 13th Dec 24
Is Trump the Most Pro-Stock Market President Ever? - 13th Dec 24
Interest Rates, Unemployment and the SPX - 13th Dec 24
Fed Balance Sheet Continues To Decline - 13th Dec 24
Trump Stocks and Crypto Mania 2025 Incoming as Bitcoin Breaks Above $100k - 8th Dec 24
Gold Price Multiple Confirmations - Are You Ready? - 8th Dec 24
Gold Price Monster Upleg Lives - 8th Dec 24
Stock & Crypto Markets Going into December 2024 - 2nd Dec 24
US Presidential Election Year Stock Market Seasonal Trend - 29th Nov 24
Who controls the past controls the future: who controls the present controls the past - 29th Nov 24
Gold After Trump Wins - 29th Nov 24
The AI Stocks, Housing, Inflation and Bitcoin Crypto Mega-trends - 27th Nov 24
Gold Price Ahead of the Thanksgiving Weekend - 27th Nov 24
Bitcoin Gravy Train Trend Forecast to June 2025 - 24th Nov 24
Stocks, Bitcoin and Crypto Markets Breaking Bad on Donald Trump Pump - 21st Nov 24
Gold Price To Re-Test $2,700 - 21st Nov 24
Stock Market Sentiment Speaks: This Is My Strong Warning To You - 21st Nov 24
Financial Crisis 2025 - This is Going to Shock People! - 21st Nov 24
Dubai Deluge - AI Tech Stocks Earnings Correction Opportunities - 18th Nov 24
Why President Trump Has NO Real Power - Deep State Military Industrial Complex - 8th Nov 24
Social Grant Increases and Serge Belamant Amid South Africa's New Political Landscape - 8th Nov 24
Is Forex Worth It? - 8th Nov 24
Nvidia Numero Uno in Count Down to President Donald Pump Election Victory - 5th Nov 24
Trump or Harris - Who Wins US Presidential Election 2024 Forecast Prediction - 5th Nov 24
Stock Market Brief in Count Down to US Election Result 2024 - 3rd Nov 24
Gold Stocks’ Winter Rally 2024 - 3rd Nov 24
Why Countdown to U.S. Recession is Underway - 3rd Nov 24
Stock Market Trend Forecast to Jan 2025 - 2nd Nov 24
President Donald PUMP Forecast to Win US Presidential Election 2024 - 1st Nov 24

Market Oracle FREE Newsletter

How to Protect your Wealth by Investing in AI Tech Stocks

Trading Opportunities - Understanding How Moving Averages Work

InvestorEducation / Learn to Trade Jan 28, 2013 - 08:04 PM GMT

By: EWI

InvestorEducation

Moving averages are a popular tool for technical traders because they can "smooth" price fluctuations in any chart. EWI Senior Analyst Jeffrey Kennedy gives a clear definition:

"A moving average is simply the average value of data over a specified time period, and it is used to figure out whether the price of a stock or commodity is trending up or down... one way to think of a moving average is that it's an automated trend line."


Moving averages are both easy to create and extraordinarily dynamic. You can choose which time frame to study as well as which data points to use (open, high, low, close or midpoint of a trading range).

Jeffrey Kennedy shares 3 of the most popular moving averages in this excerpt is from his 10-page eBook: How to Trade the Highest Probability Opportunities: Moving Averages. Learn how you can download the entire eBook here >>

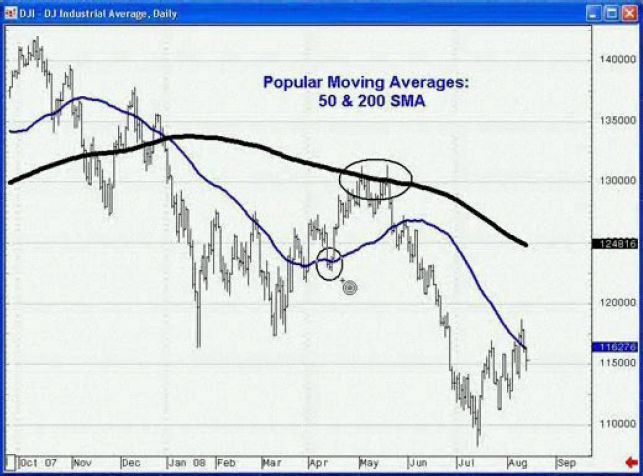
Let's begin with the most commonly-used moving averages among market technicians: the 50- and 200-day simple moving averages. These two trend lines often serve as areas of resistance or support.

For example, the chart below shows the circled areas where the 200-period SMA provided resistance in an April-to-May upward move in the DJIA (top circle on the heavy black line), and the 50-period SMA provided support (lower circle on the blue line).
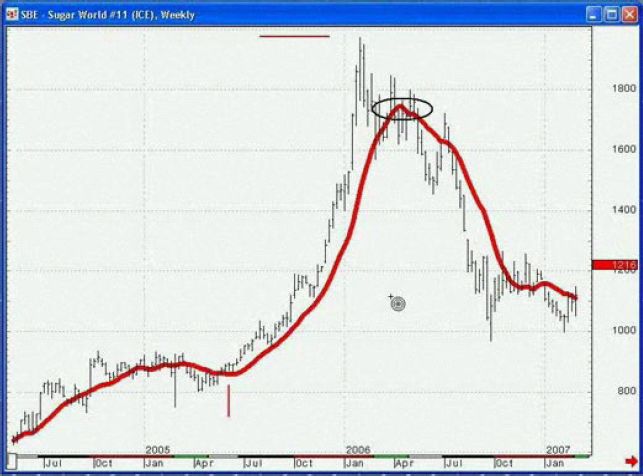
The 13-period SMA is a widely used simple moving average that works equally well in commodities, currencies, and stocks. In the sugar chart below, prices crossed the line (marked by the short, red vertical line), and that cross led to a substantial rally. This chart also shows a whipsaw in the market, which is circled:
Another popular moving average setting that many people work with is the 13- and the 26-period moving averages in tandem. The figure below shows a crossover system, using a 13-week and a 26-week simple moving average of the close on a 2004 stock chart of Johnson & Johnson. Obviously, the number 26 is two times 13:
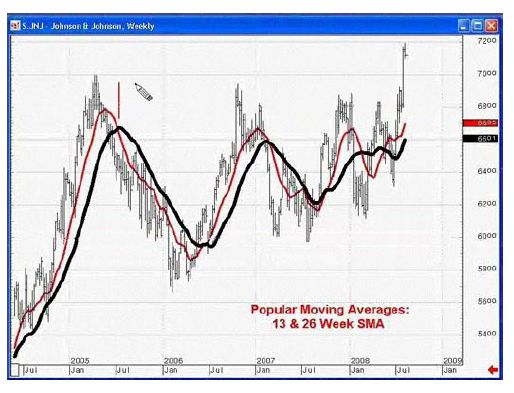
During this four-year period, the range in this stock was a little over $20.00, which is not much price appreciation. This dual moving average system worked well in a relatively bad market by identifying a number of buyside and sellside trading opportunities.

During this four-year period, the range in this stock was a little over $20.00, which is not much price appreciation. This dual moving average system worked well in a relatively bad market by identifying a number of buyside and sellside trading opportunities.

How to Trade the Highest Probability Opportunities: Moving Averages

Moving averages are one of the most widely-used methods of technical analysis because they are simple to use, and they work. Now you can learn how to apply them to your trading and investing in this free 10-page eBook. Learn step-by-step how moving averages can help you find high-probability trading opportunities.

Improve your trading and investing with Moving Averages! Download Your Free eBook Now >>

This article was syndicated by Elliott Wave International and was originally published under the headline Moving Averages Can Identify a Trade - FREE Lesson. EWI is the world's largest market forecasting firm. Its staff of full-time analysts led by Chartered Market Technician Robert Prechter provides 24-hour-a-day market analysis to institutional and private investors around the world.


© 2005-2022 http://www.MarketOracle.co.uk - The Market Oracle is a FREE Daily Financial Markets Analysis & Forecasting online publication.


Post Comment

Only logged in users are allowed to post comments. Register/ Log in